Why One Linux Server Handles More Users Than You Think
Users are not requests: 10,000 visitors a day is about 12 requests a second at the busiest minute. On one Linux server cut to one CPU core and 1 GB of memory we measure it for real: 94,475 page requests a second from nginx, 8,170 from a Python app with a database, 5,000 idle connections for 20 MB, what full looks like (slower answers, not errors), a missing index taking the app to 212 a second, and a server that is full while its core is 2% busy, because its workers are waiting.
One core, a flood of requests
You probably think ten thousand users need a cluster of servers: a load balancer and a row of machines. A farmers market's order-ahead site runs on one Linux server instead, cut down to one CPU core and one gigabyte of memory.
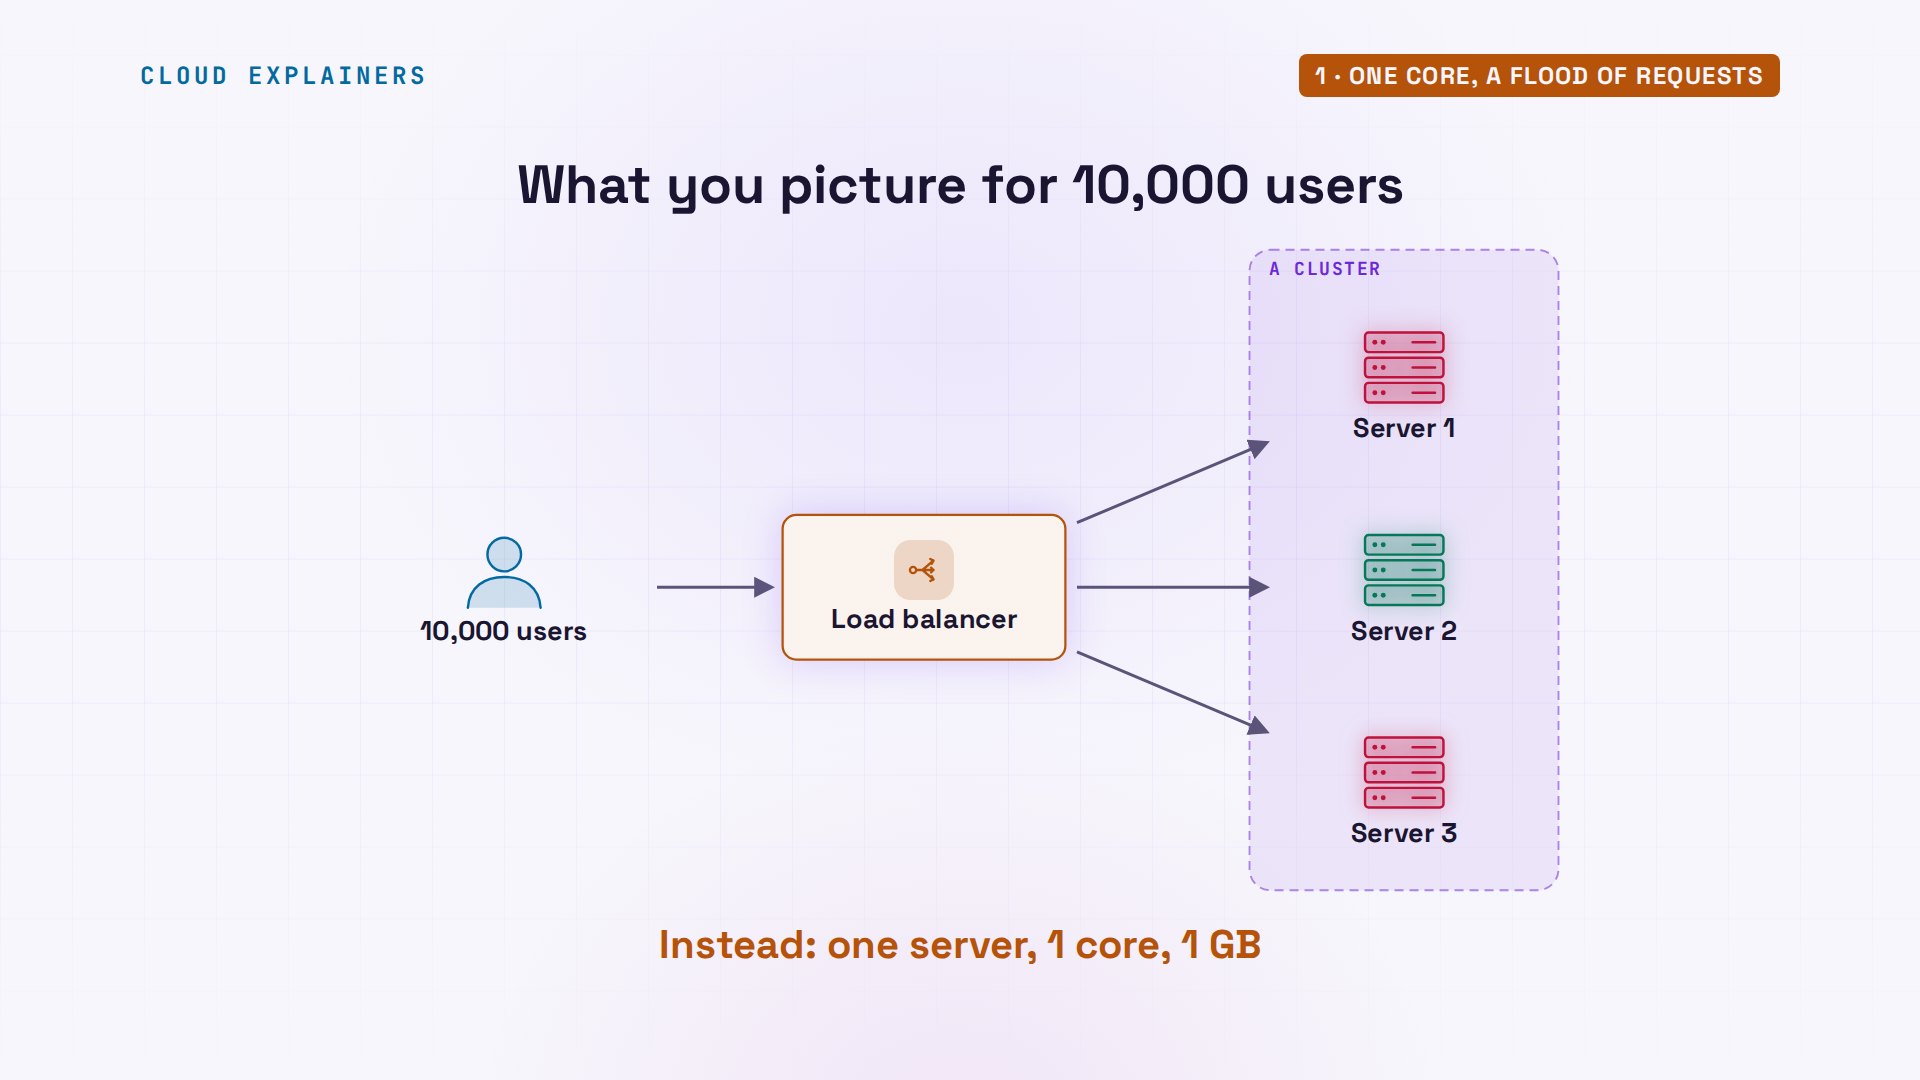
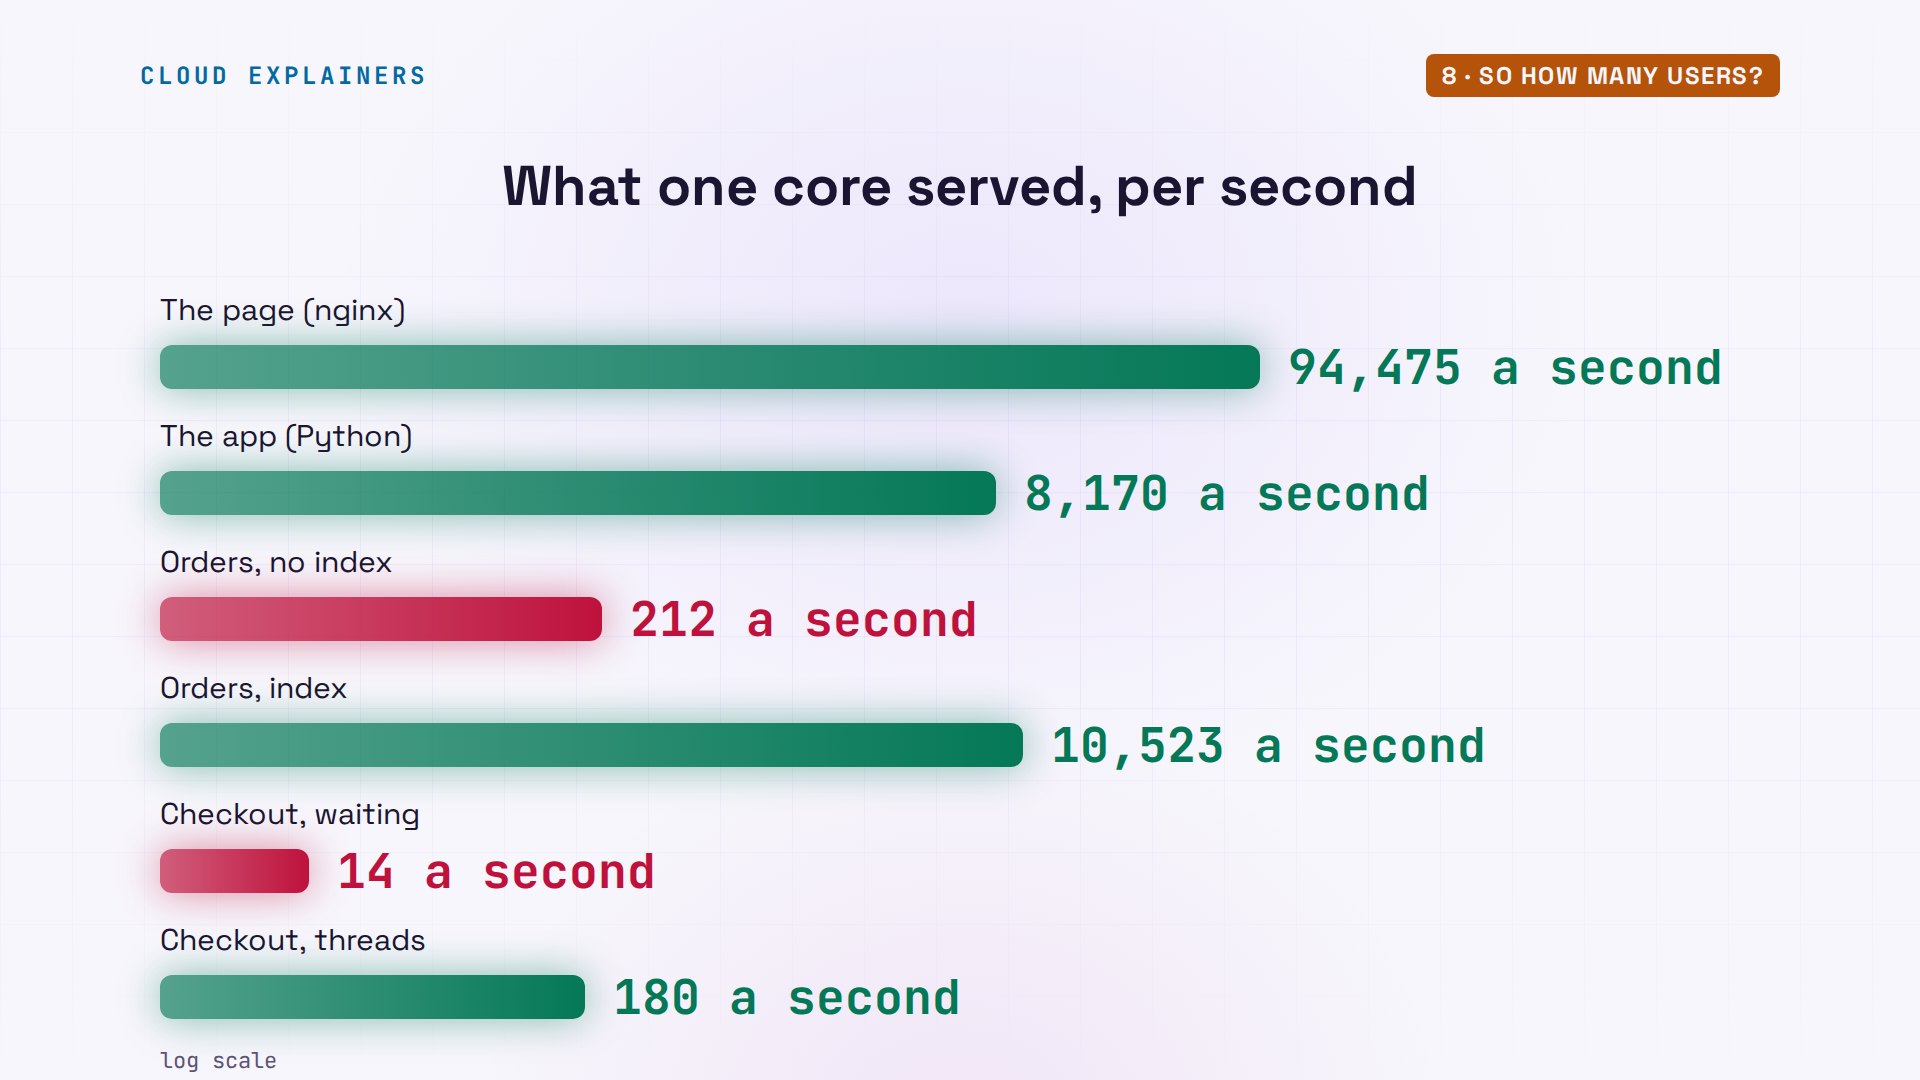
nproc counts its cores: one. wrk, a load tester on Ana's laptop, asks for the market's page as fast as it can for ten seconds, over fifty connections at once. Over ninety-four thousand requests a second, from one core. Later, we'll fill it up while its core sits almost idle.
nproc1
wrk -t2 -c50 -d10s http://market/Running 10s test @ http://market/
  2 threads and 50 connections
  Thread Stats   Avg      Stdev     Max   +/- Stdev
    Latency   530.07us  110.10us  12.21ms   98.76%
    Req/Sec    47.47k     2.71k   51.06k    79.50%
  944804 requests in 10.00s, 1.46GB read
Requests/sec:  94474.56
Transfer/sec:    149.38MB
Users are not requests
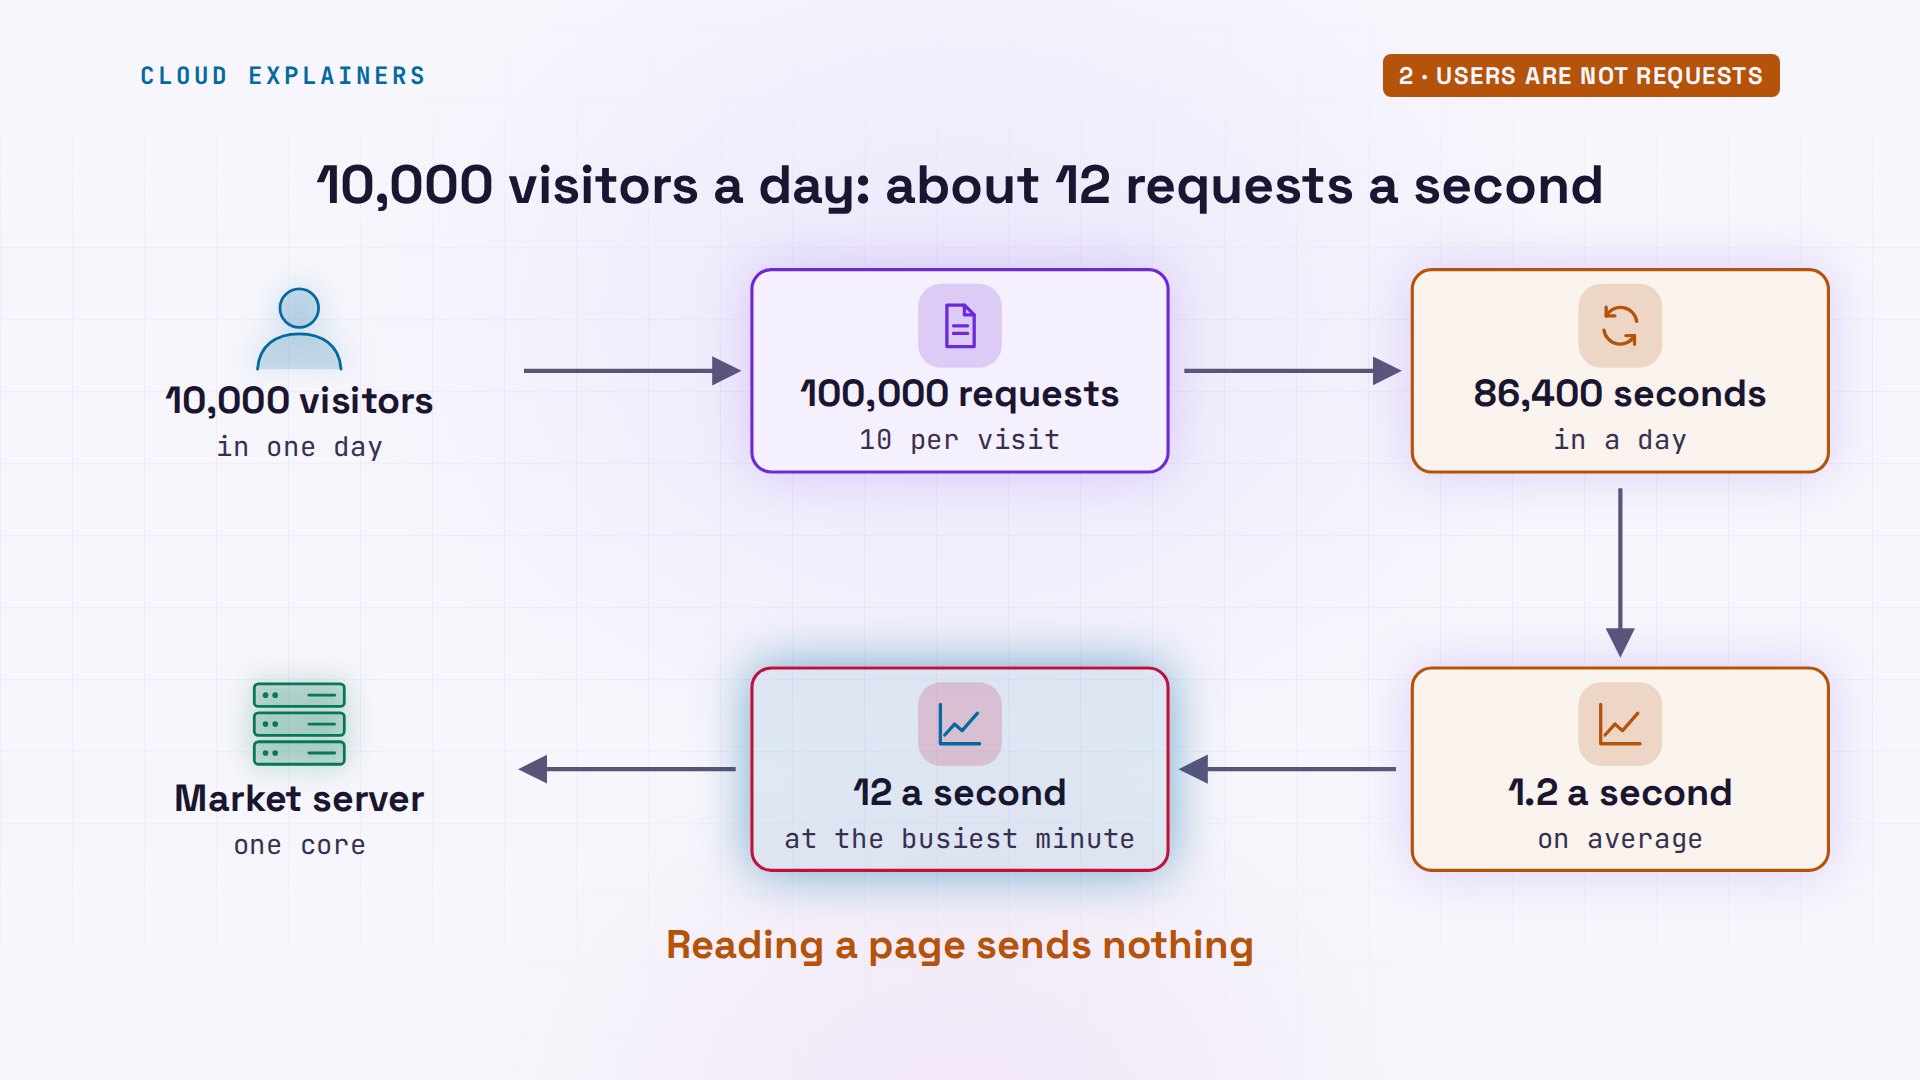
Why does that sound wrong? Because users and requests are different things. Say ten thousand people visit in a day, and each visit asks the server ten times. That's a hundred thousand requests, spread over the eighty-six thousand four hundred seconds in a day: about one point two a second. Even if your busiest minute runs ten times the average, that's about twelve a second, for a core that just answered thousands. And users online right now aren't requests either: someone reading the market's stalls for a minute sends nothing during that minute.
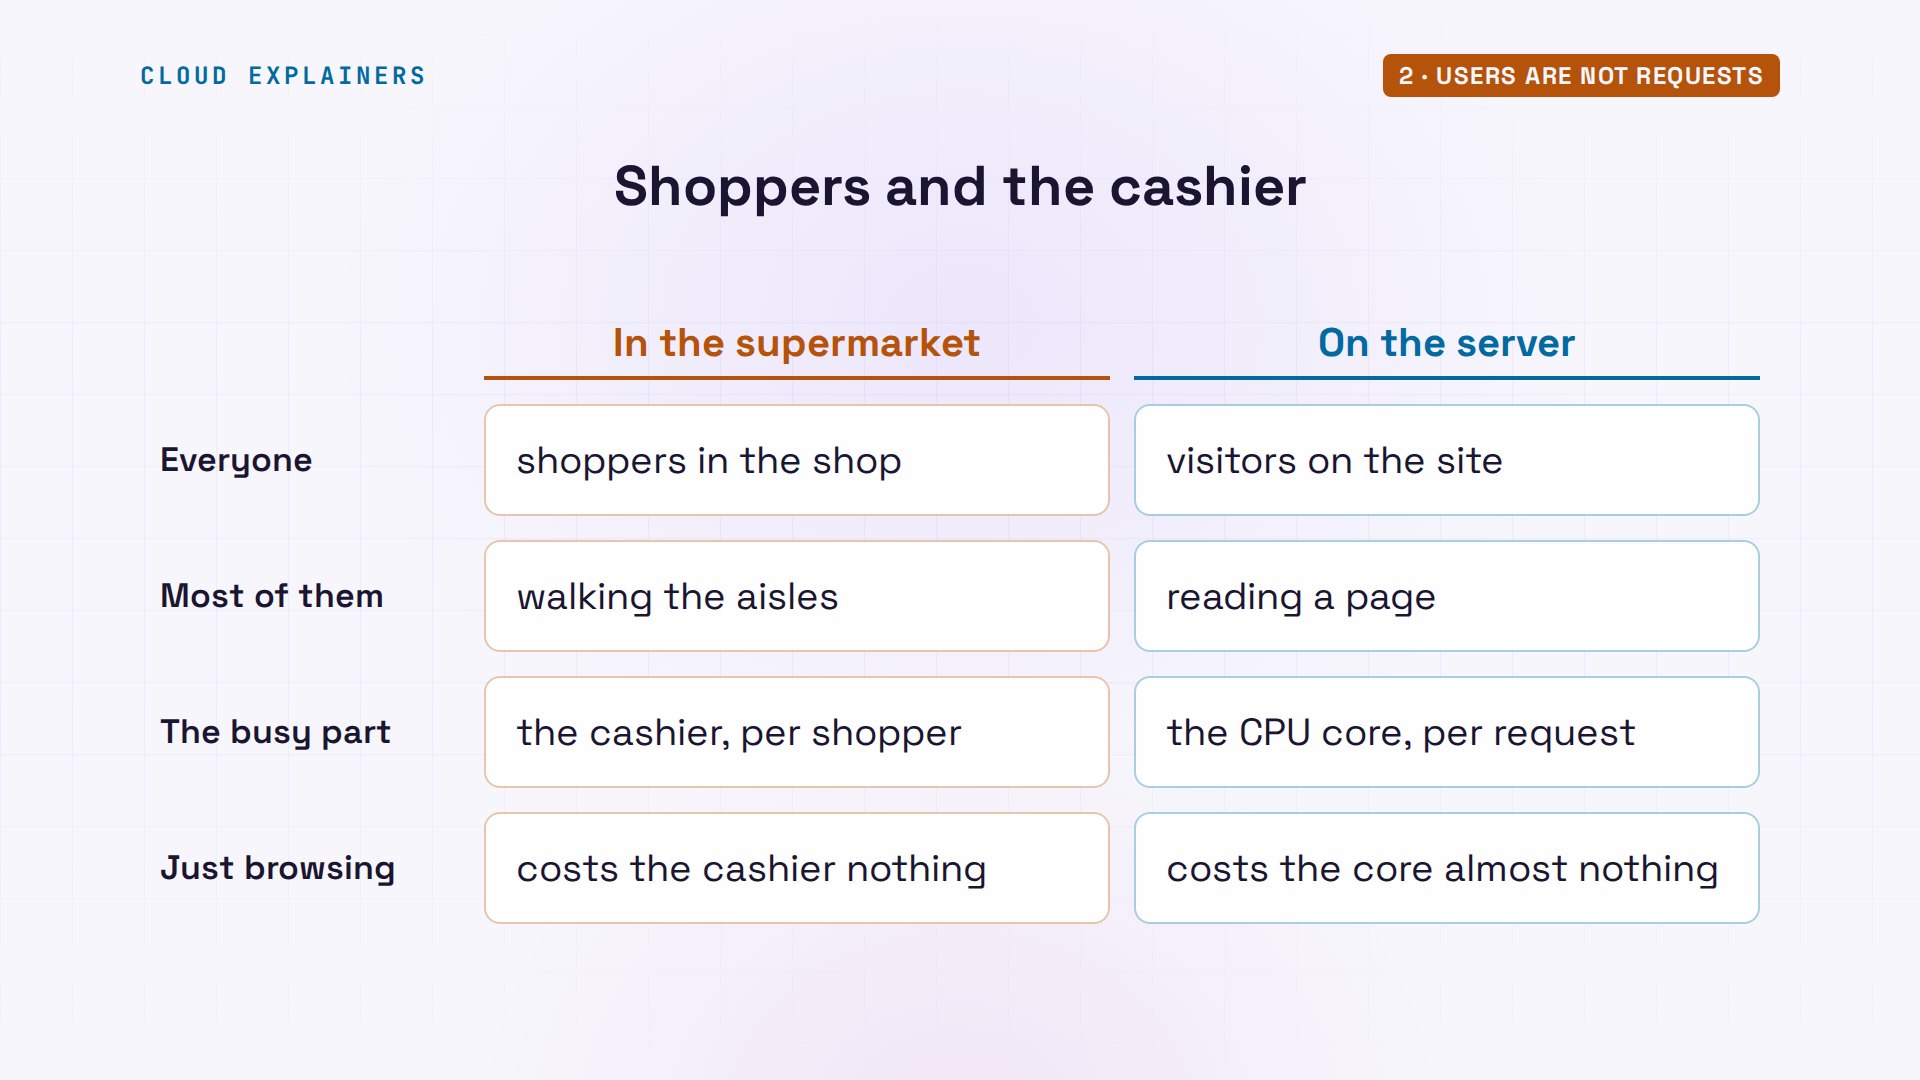
Think of a supermarket. Hundreds of shoppers are inside, but most of them are walking the aisles. Only the few at the till need the cashier. The server's core is the cashier. A visitor reading a page is a shopper in the aisles: they cost it almost nothing. Only requests, the moments at the till, take its time.
Real code, same core
But that page was one file nginx, the web server, just sends. Real sites run code. Here, nginx passes every request for the market's app to Python, which reads the stalls' products from a database, each time. Guess first: how many a second does the same core manage now? About eight thousand, each answered in one point two milliseconds. About twelve times fewer than the page, because nginx copies a file it already has, while the app runs Python and asks the database every time. Still, that's hundreds of times what ten thousand visitors need.
wrk -t2 -c10 -d10s http://market/api/stallsRunning 10s test @ http://market/api/stalls
  2 threads and 10 connections
  Thread Stats   Avg      Stdev     Max   +/- Stdev
    Latency     1.23ms  408.76us  14.67ms   86.73%
    Req/Sec     4.11k   163.44     4.24k    97.00%
  81740 requests in 10.01s, 210.63MB read
Requests/sec:   8169.76
Transfer/sec:     21.05MB
Open tabs cost almost nothing
And people who just have the market's page open? On the server, memused, a small script that reads its memory, says: ninety-six megabytes. Then the laptop opens five thousand connections, loads the page on each, and leaves them open and idle for forty seconds, like five thousand browser tabs. ss, which lists network connections, counts them on the server: five thousand, established. Memory now: a hundred and sixteen. Twenty megabytes for five thousand open tabs: about four kilobytes each. Shoppers in the aisles.
memusedMemory in use: 96 MB of 1024 MB
python3 idle.py 5000 405000 connections open, page loaded on each, now idle for 40 s
ss -sTotal: 5045
TCP:   24788 (estab 5000, closed 19785, orphaned 0, timewait 14759)

Transport Total     IP        IPv6
RAW	  0         0         0
UDP	  1         1         0
TCP	  5003      5003      0
INET	  5004      5004      0
FRAG	  0         0         0
memusedMemory in use: 116 MB of 1024 MB
When it's full, a line forms
So what does full look like? Ana points four hundred connections at the market's app, each asking again the moment it gets an answer. On the server, cpuused reads how busy its core is: a hundred percent. Requests a second: about eight thousand, the same as with ten connections. But each answer now takes forty-nine milliseconds, instead of one point two.
wrk -t2 -c400 -d10s http://market/api/stallsRunning 10s test @ http://market/api/stalls
  2 threads and 400 connections
  Thread Stats   Avg      Stdev     Max   +/- Stdev
    Latency    48.68ms    3.23ms  83.34ms   77.83%
    Req/Sec     4.12k   205.67     4.58k    86.50%
  82230 requests in 10.06s, 211.89MB read
Requests/sec:   8177.08
Transfer/sec:     21.07MB
cpuused 3CPU busy: 100% of 1 core over the last 3 s
Back at the supermarket: a longer line doesn't make the cashier scan faster. Past the limit, more requests don't get served faster. They wait. So a full server rarely shows up as errors first. It shows up as answers getting slower.
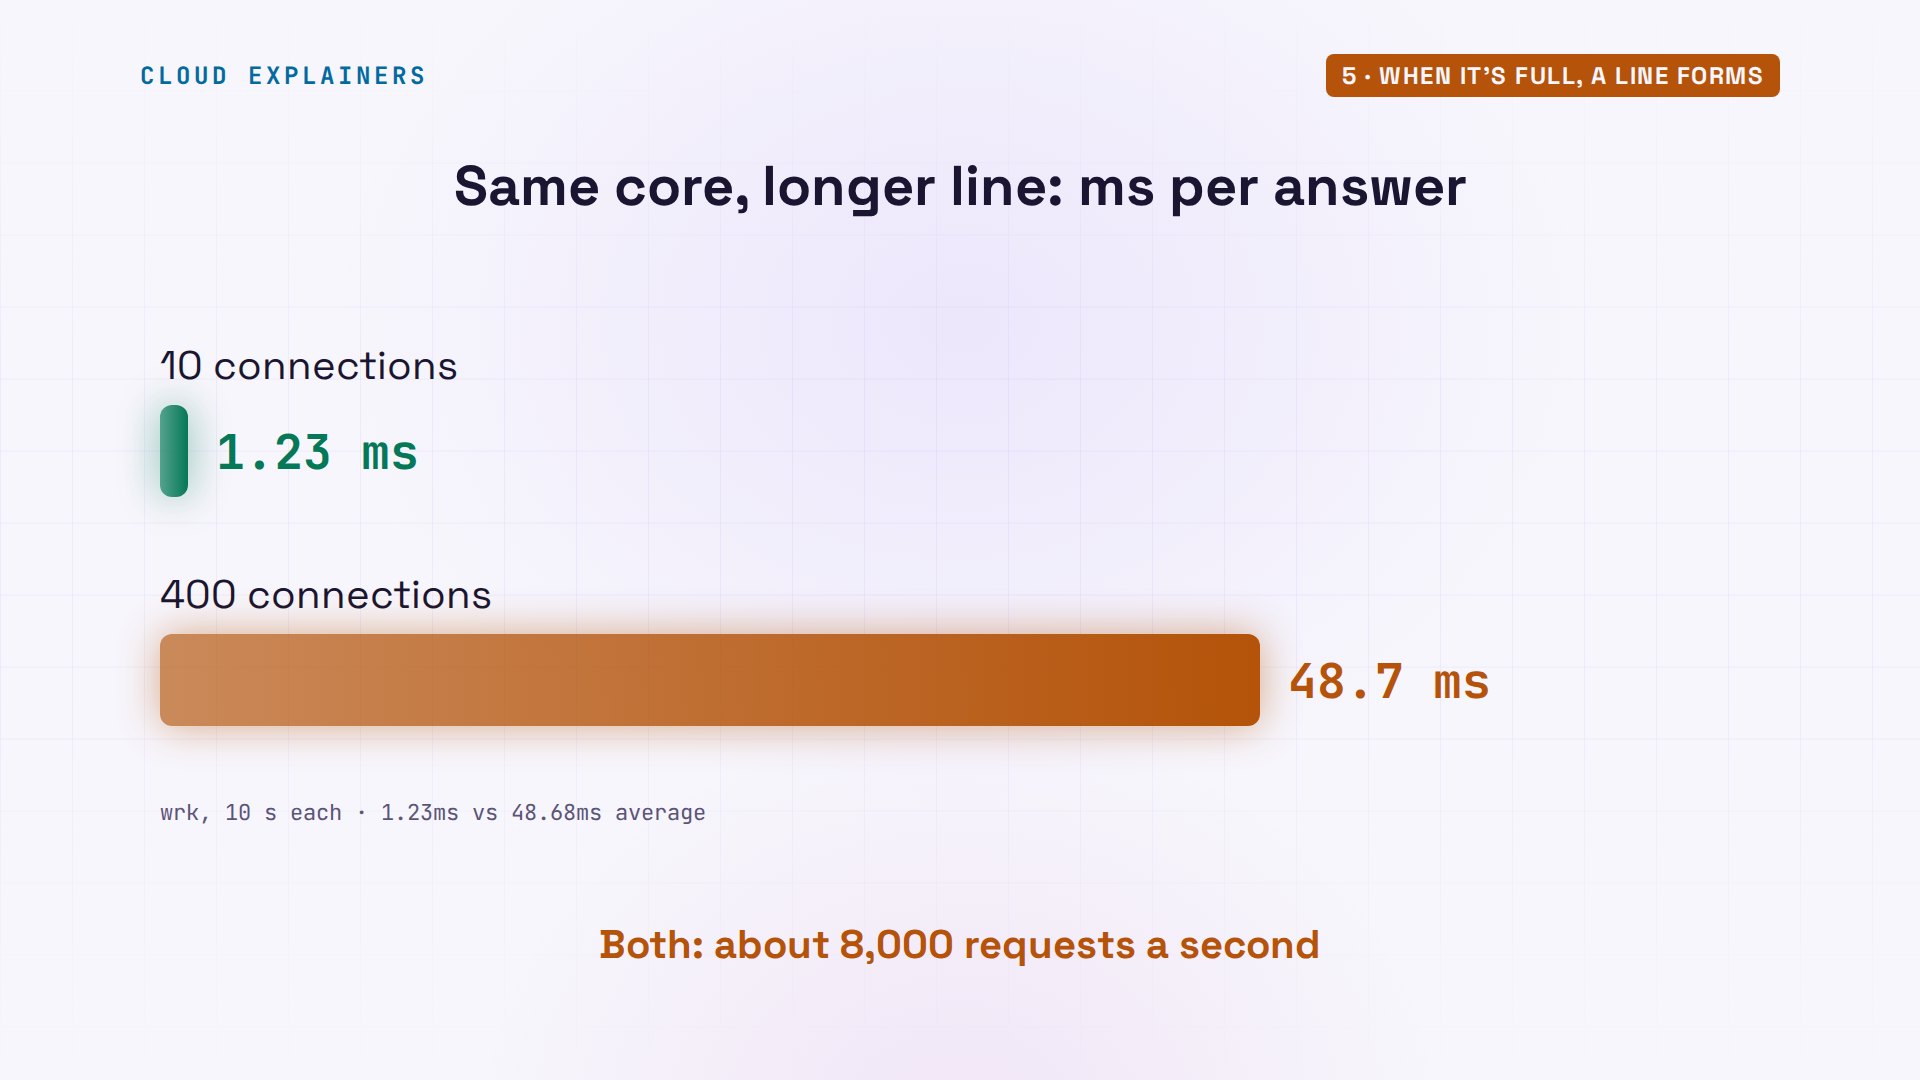
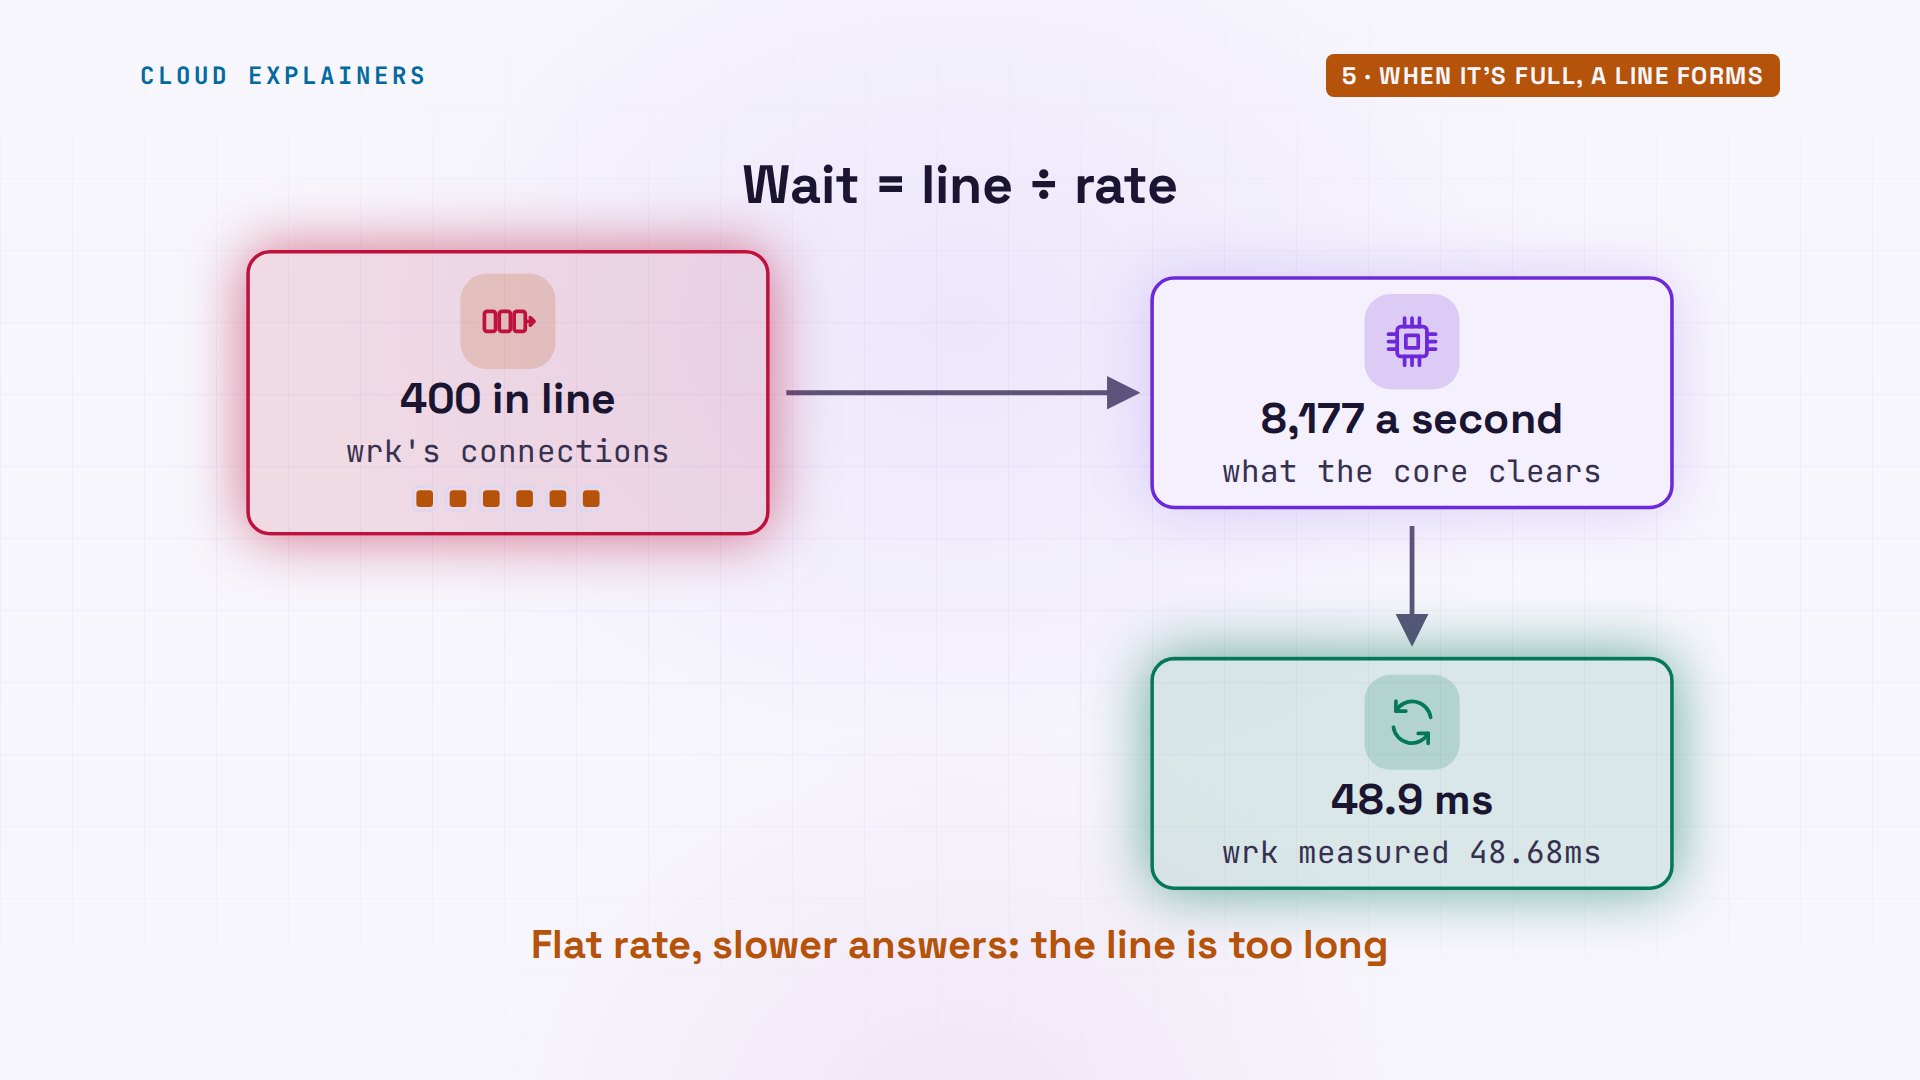
There's a simple rule hiding in those numbers. The wait is the line divided by the rate. Four hundred requests in line, served at about eight thousand two hundred a second: forty-nine thousandths of a second each. Just what wrk measured. So when the rate stays flat and the answers slow down, the line is longer than the core can clear.
The slowest step sets the limit
So is the core always the limit? Usually, the limit is the slowest thing a request does. The app's past-orders page looks up one customer's orders: about two hundred and twelve a second. Why so few? On the server, SQLite's query plan, how the database will find the rows, says this about the lookup: scan orders. To find one customer, it reads all five hundred thousand orders. And this table grows every market day, so the lookup gets slower every week, without a single extra visitor.
wrk -t2 -c20 -d10s "http://market/api/orders?customer=1234"Running 10s test @ http://market/api/orders?customer=1234
  2 threads and 20 connections
  Thread Stats   Avg      Stdev     Max   +/- Stdev
    Latency    93.93ms    5.20ms 138.33ms   75.44%
    Req/Sec   106.29      9.17   121.00     78.79%
  2125 requests in 10.03s, 1.28MB read
Requests/sec:    211.92
Transfer/sec:    131.21KB
sqlite3 market.db "EXPLAIN QUERY PLAN SELECT * FROM orders WHERE customer_id = 1234"QUERY PLAN
`--SCAN orders
An index is a sorted list of one column, pointing at the rows. Without it, every lookup walks the whole table. With it, the database jumps straight to that customer's few orders.
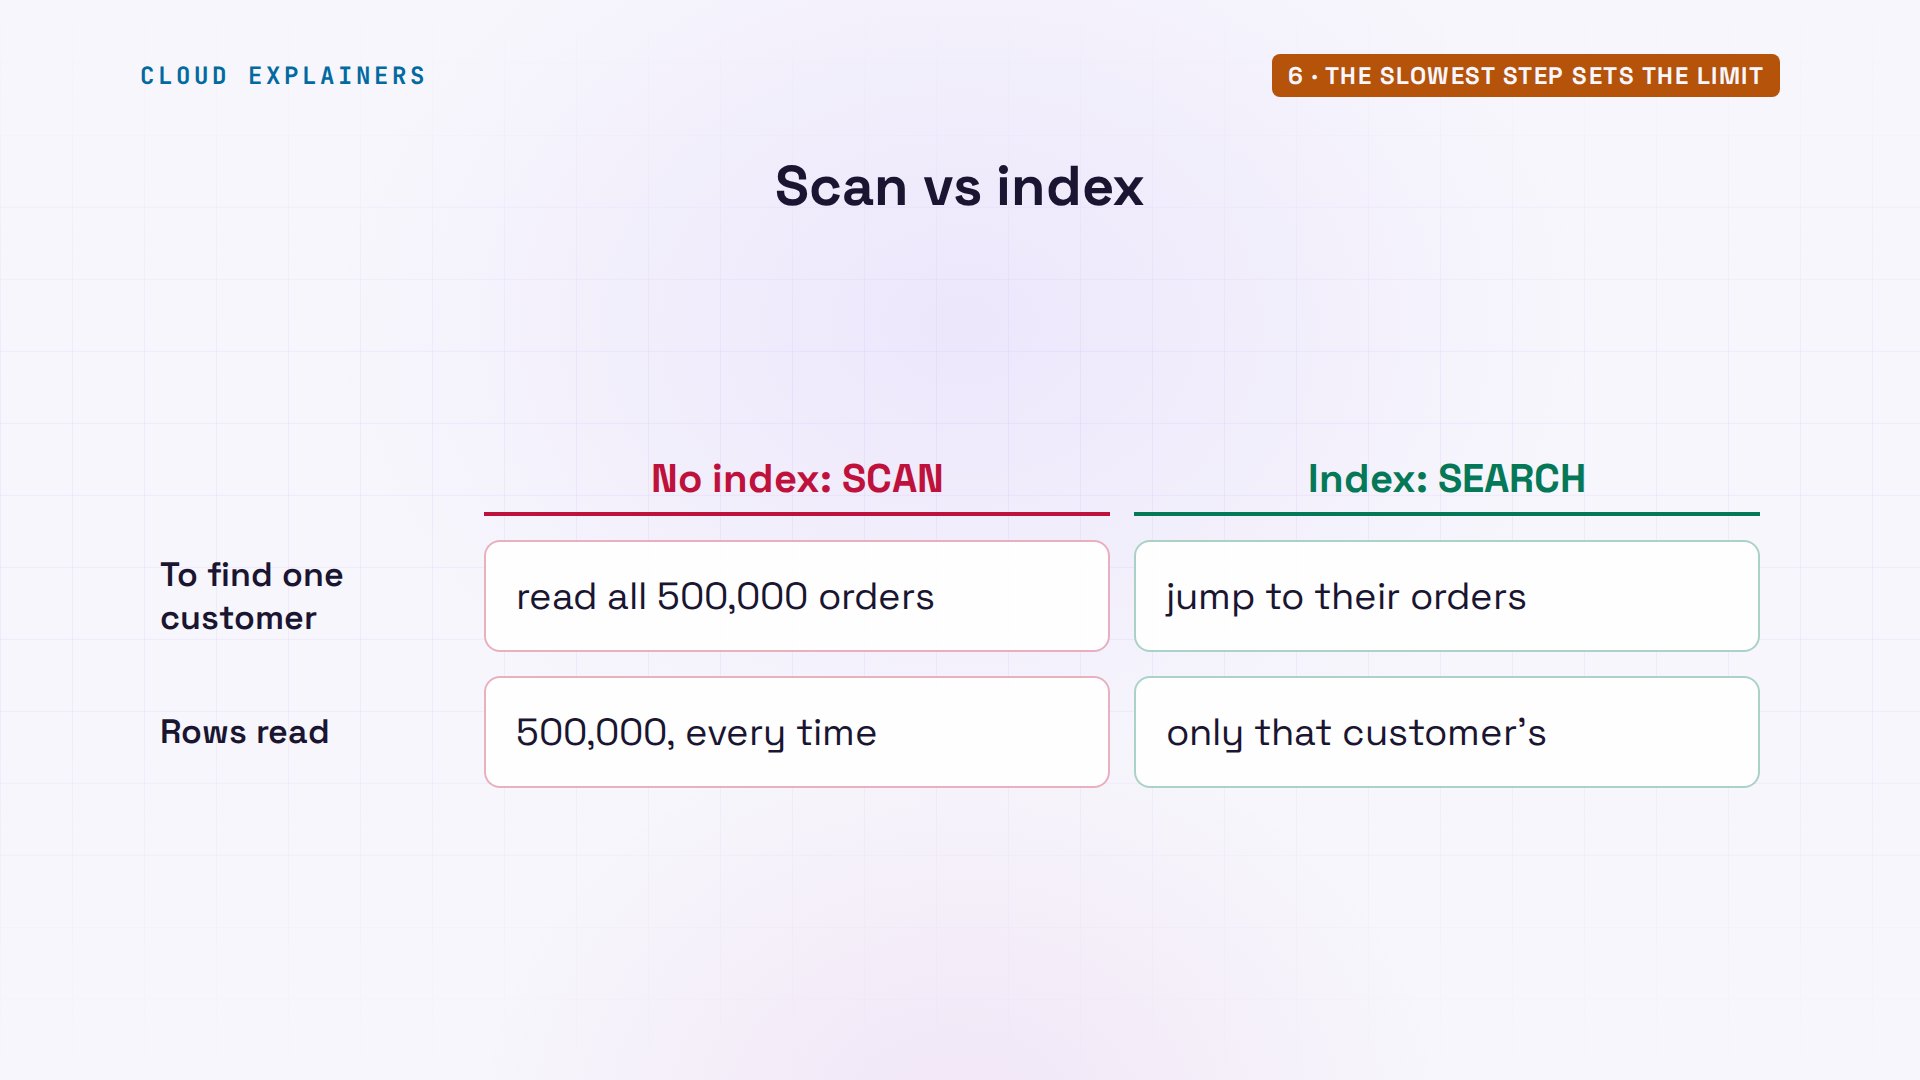
Ana adds one index on the customer column. It takes a fraction of a second. Now the plan says search, using the index. Guess first: how many lookups a second now? Over ten thousand. About fifty times more, from one line, on the same core.
time sqlite3 market.db "CREATE INDEX orders_by_customer ON orders(customer_id)"real	0m0.154s
user	0m0.081s
sys	0m0.006s
sqlite3 market.db "EXPLAIN QUERY PLAN SELECT * FROM orders WHERE customer_id = 1234"QUERY PLAN
`--SEARCH orders USING INDEX orders_by_customer (customer_id=?)
wrk -t2 -c20 -d10s "http://market/api/orders?customer=1234"Running 10s test @ http://market/api/orders?customer=1234
  2 threads and 20 connections
  Thread Stats   Avg      Stdev     Max   +/- Stdev
    Latency     1.91ms  538.59us  22.85ms   88.71%
    Req/Sec     5.29k   223.77     5.54k    96.50%
  105296 requests in 10.01s, 63.66MB read
Requests/sec:  10523.17
Transfer/sec:      6.36MB
Full, with the core asleep
Now the checkout. To take a payment, the app asks a card payment service, which answers in about two hundred milliseconds, like a real card processor. Fifty shoppers check out at once. And the core? Busy two percent of the time. Checkouts: fourteen a second. Each waits almost three seconds. This is the full server whose core is asleep.
wrk -t2 -c50 -d10s --timeout 30s -s post.lua http://market/api/checkoutRunning 10s test @ http://market/api/checkout
  2 threads and 50 connections
  Thread Stats   Avg      Stdev     Max   +/- Stdev
    Latency     2.96s   987.35ms   3.65s    80.71%
    Req/Sec     7.38      4.30    29.00     80.95%
  140 requests in 10.02s, 24.20KB read
Requests/sec:     13.97
Transfer/sec:      2.42KB
cpuused 3CPU busy: 2% of 1 core over the last 3 s
Why? The app runs three workers, and each handles one request at a time. While a worker waits for the card service, it does nothing else. Three workers, two hundred milliseconds each: at most fifteen a second, however idle the core is. Three cashiers, each on the phone to the bank.
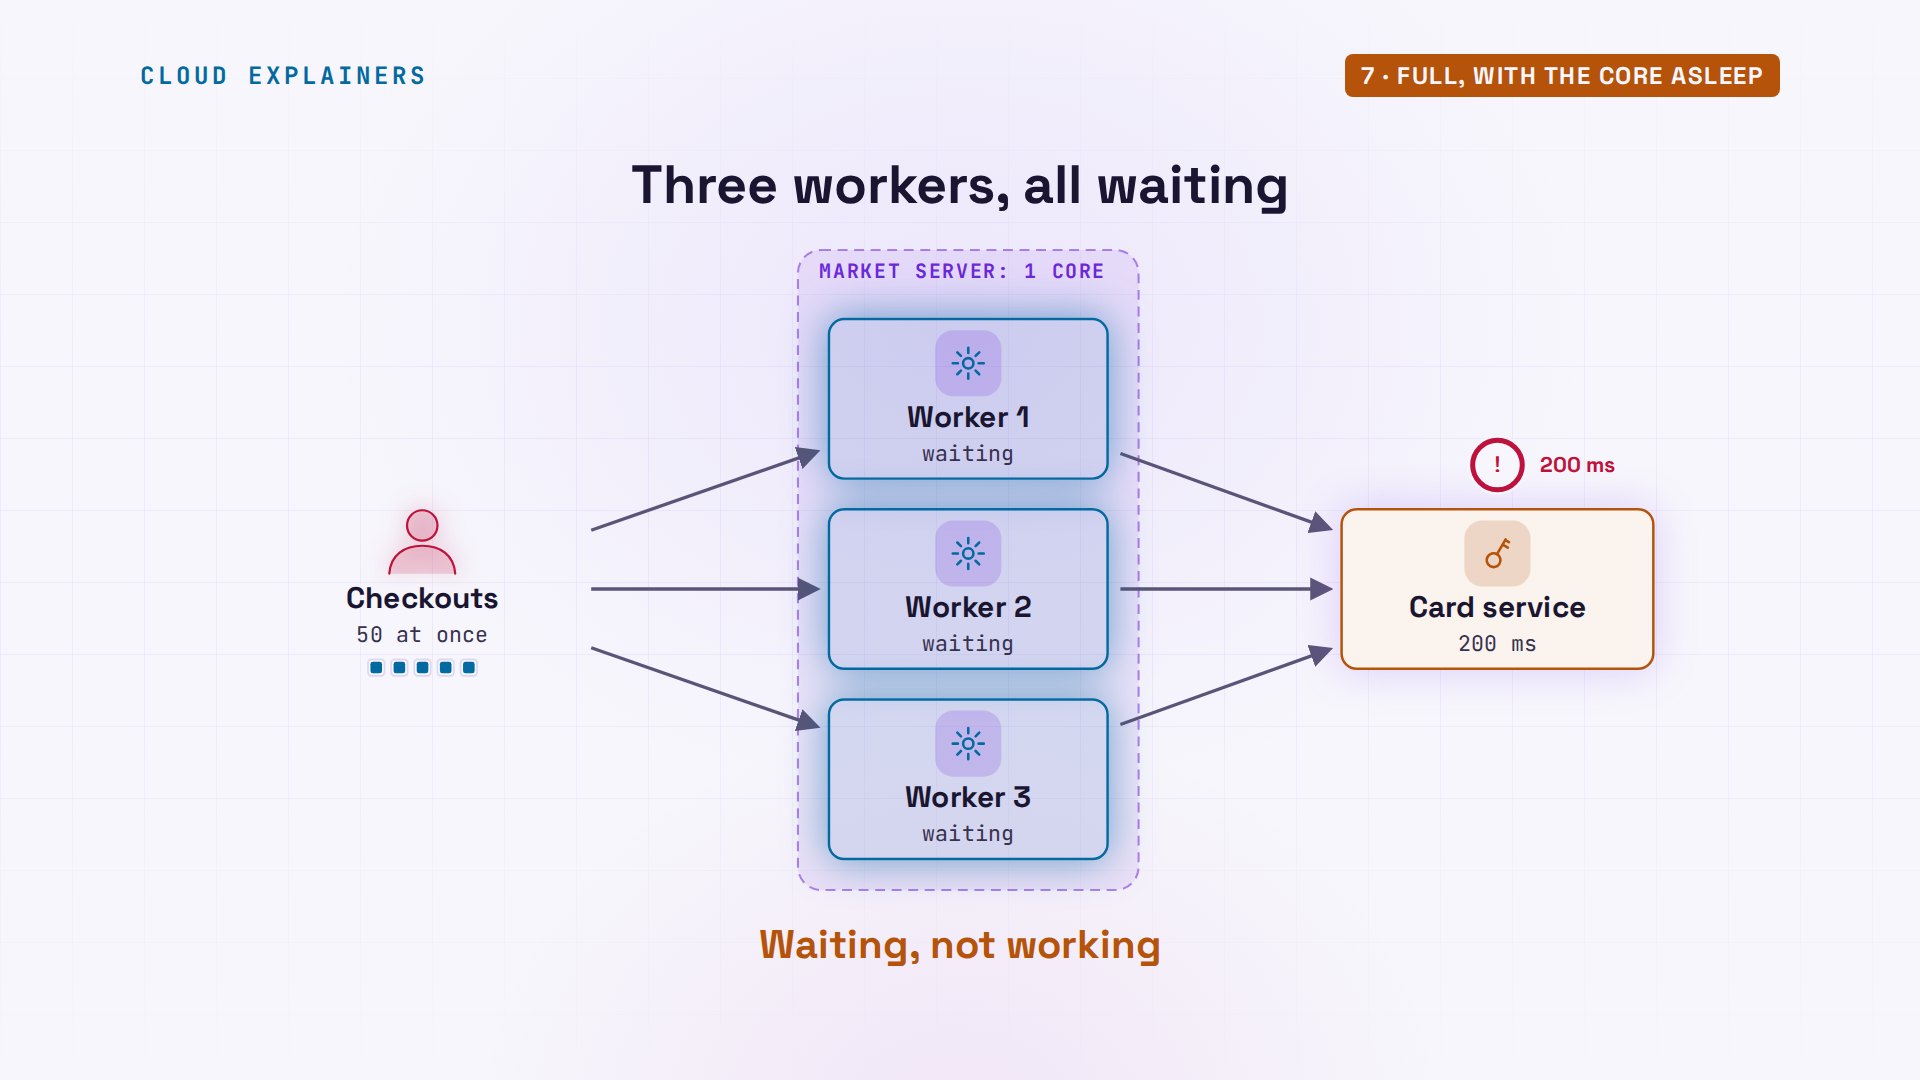
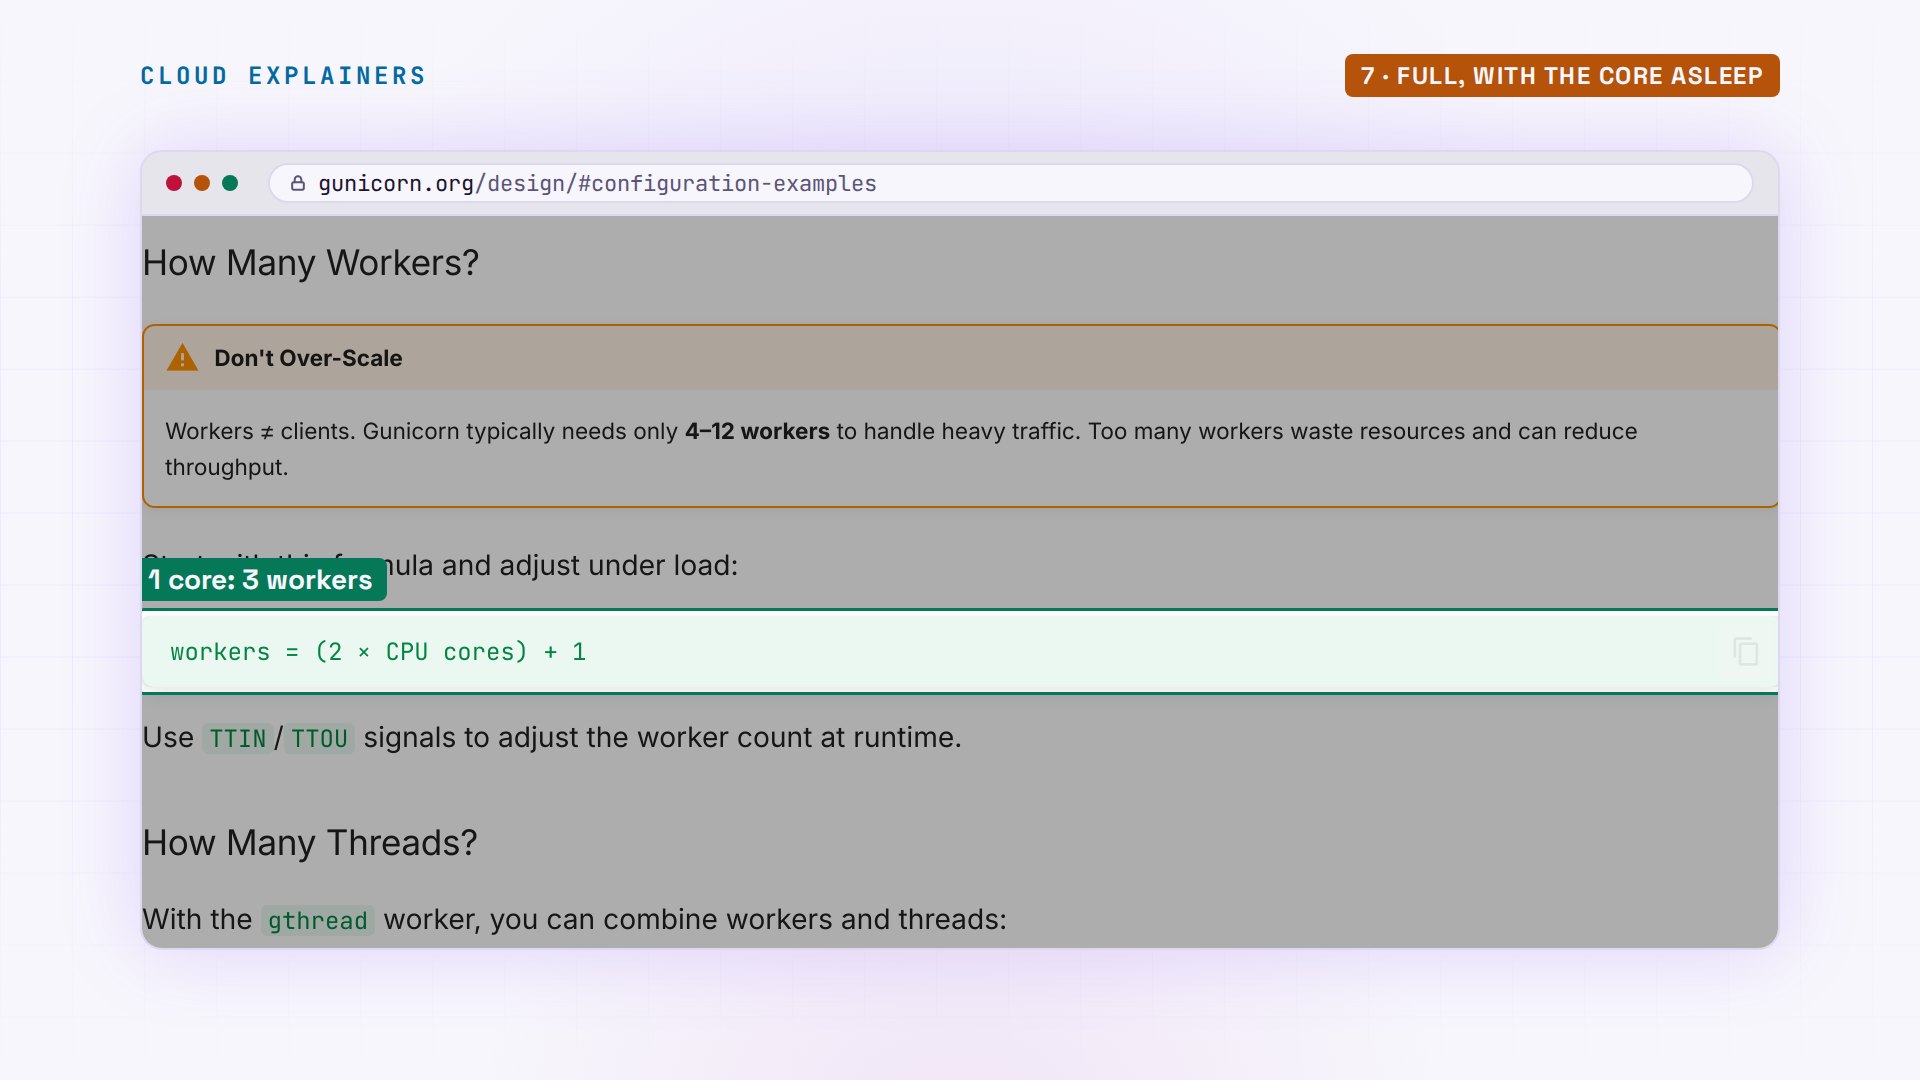
gunicorn, the program that runs these workers, says it on its own design page: workers are not clients. A handful of workers handles heavy traffic. Its starting formula, two per core plus one, gives three, for this server's single core. For waiting, the same page offers threads: one worker, many requests waiting side by side.
So one setting changes, in the service file that tells Linux how to run the app: threads, twenty-five per worker. That's seventy-five checkouts that can wait at the same time.
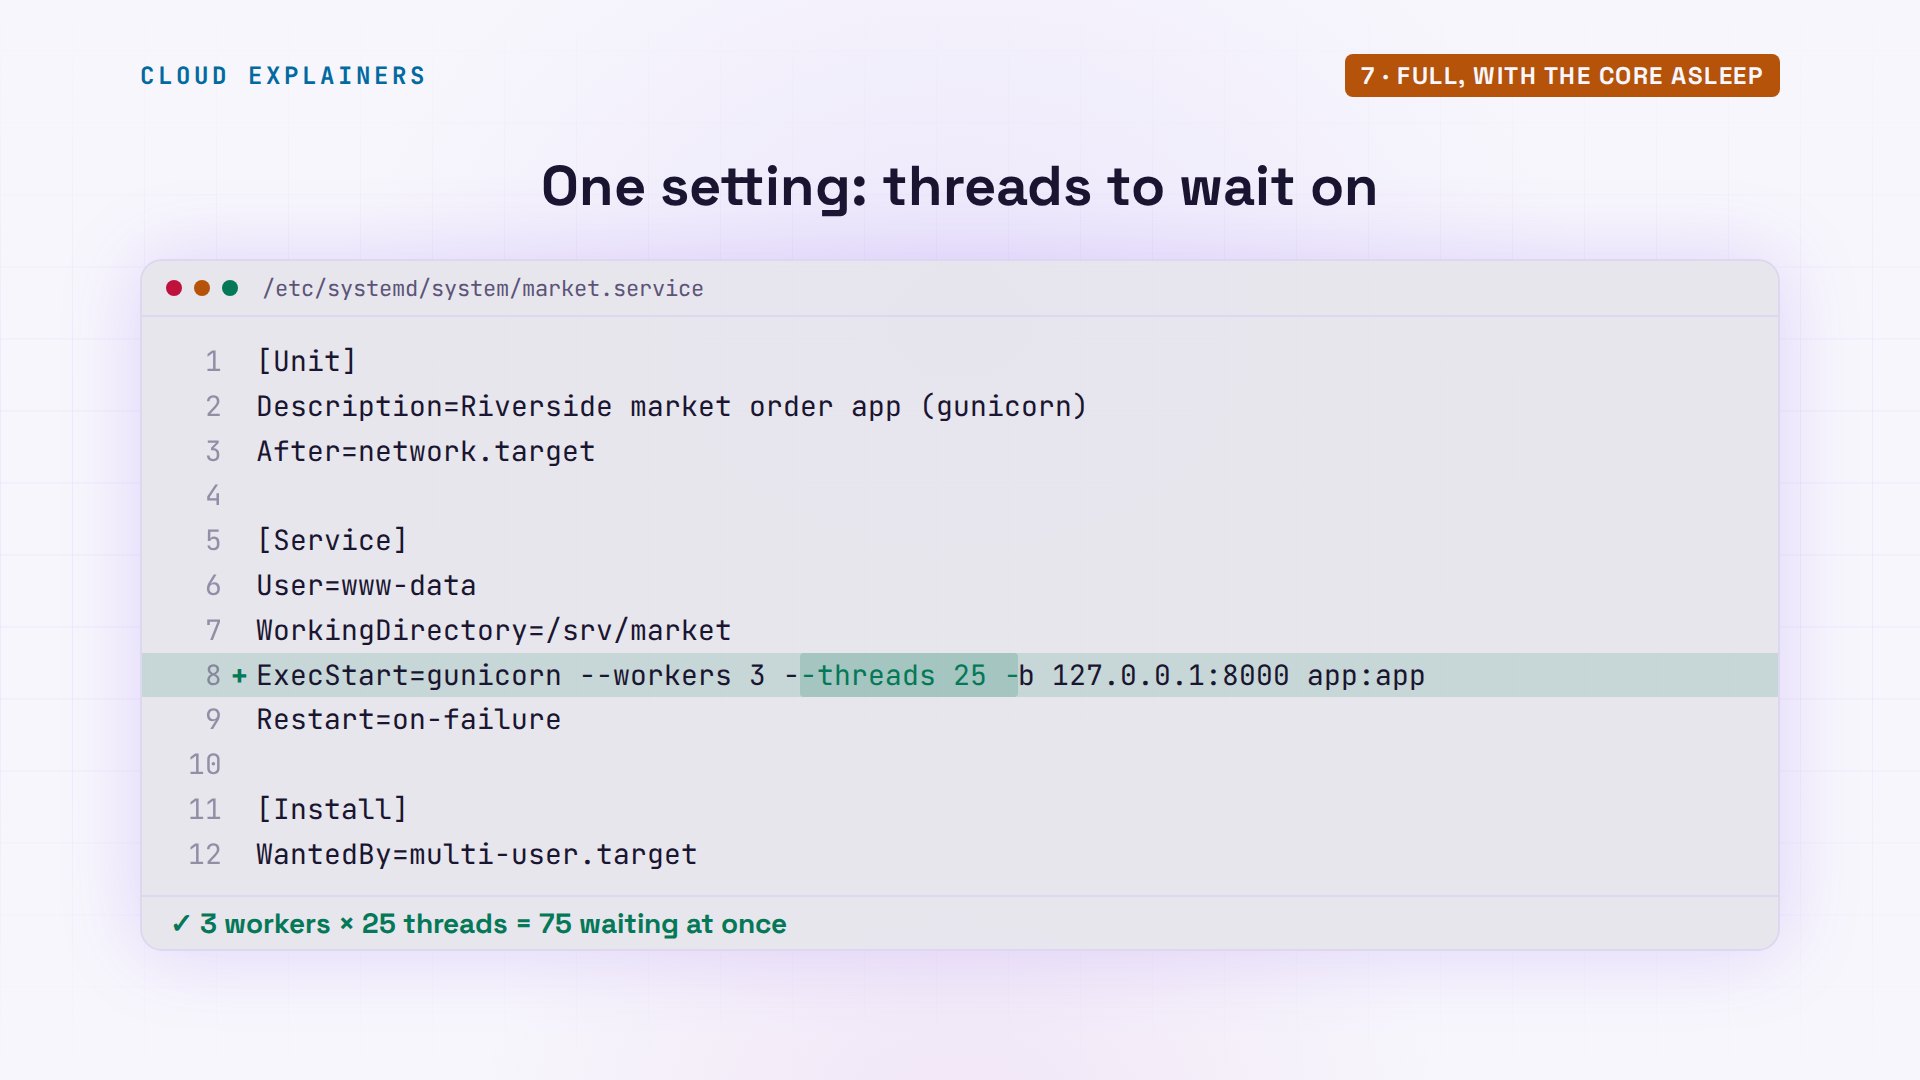
Ana reloads that file and restarts the app, and the same fifty checkouts: a hundred and eighty a second, each in about a quarter of a second. Same core. Same memory. Threads help when a request waits. When it's busy computing, only more core time helps.
sudo systemctl daemon-reload && sudo systemctl restart market
wrk -t2 -c50 -d10s --timeout 30s -s post.lua http://market/api/checkoutRunning 10s test @ http://market/api/checkout
  2 threads and 50 connections
  Thread Stats   Avg      Stdev     Max   +/- Stdev
    Latency   271.93ms   98.14ms 603.45ms   77.80%
    Req/Sec    94.53     35.88   213.00     85.42%
  1812 requests in 10.08s, 313.21KB read
Requests/sec:    179.72
Transfer/sec:     31.07KB
So how many users?
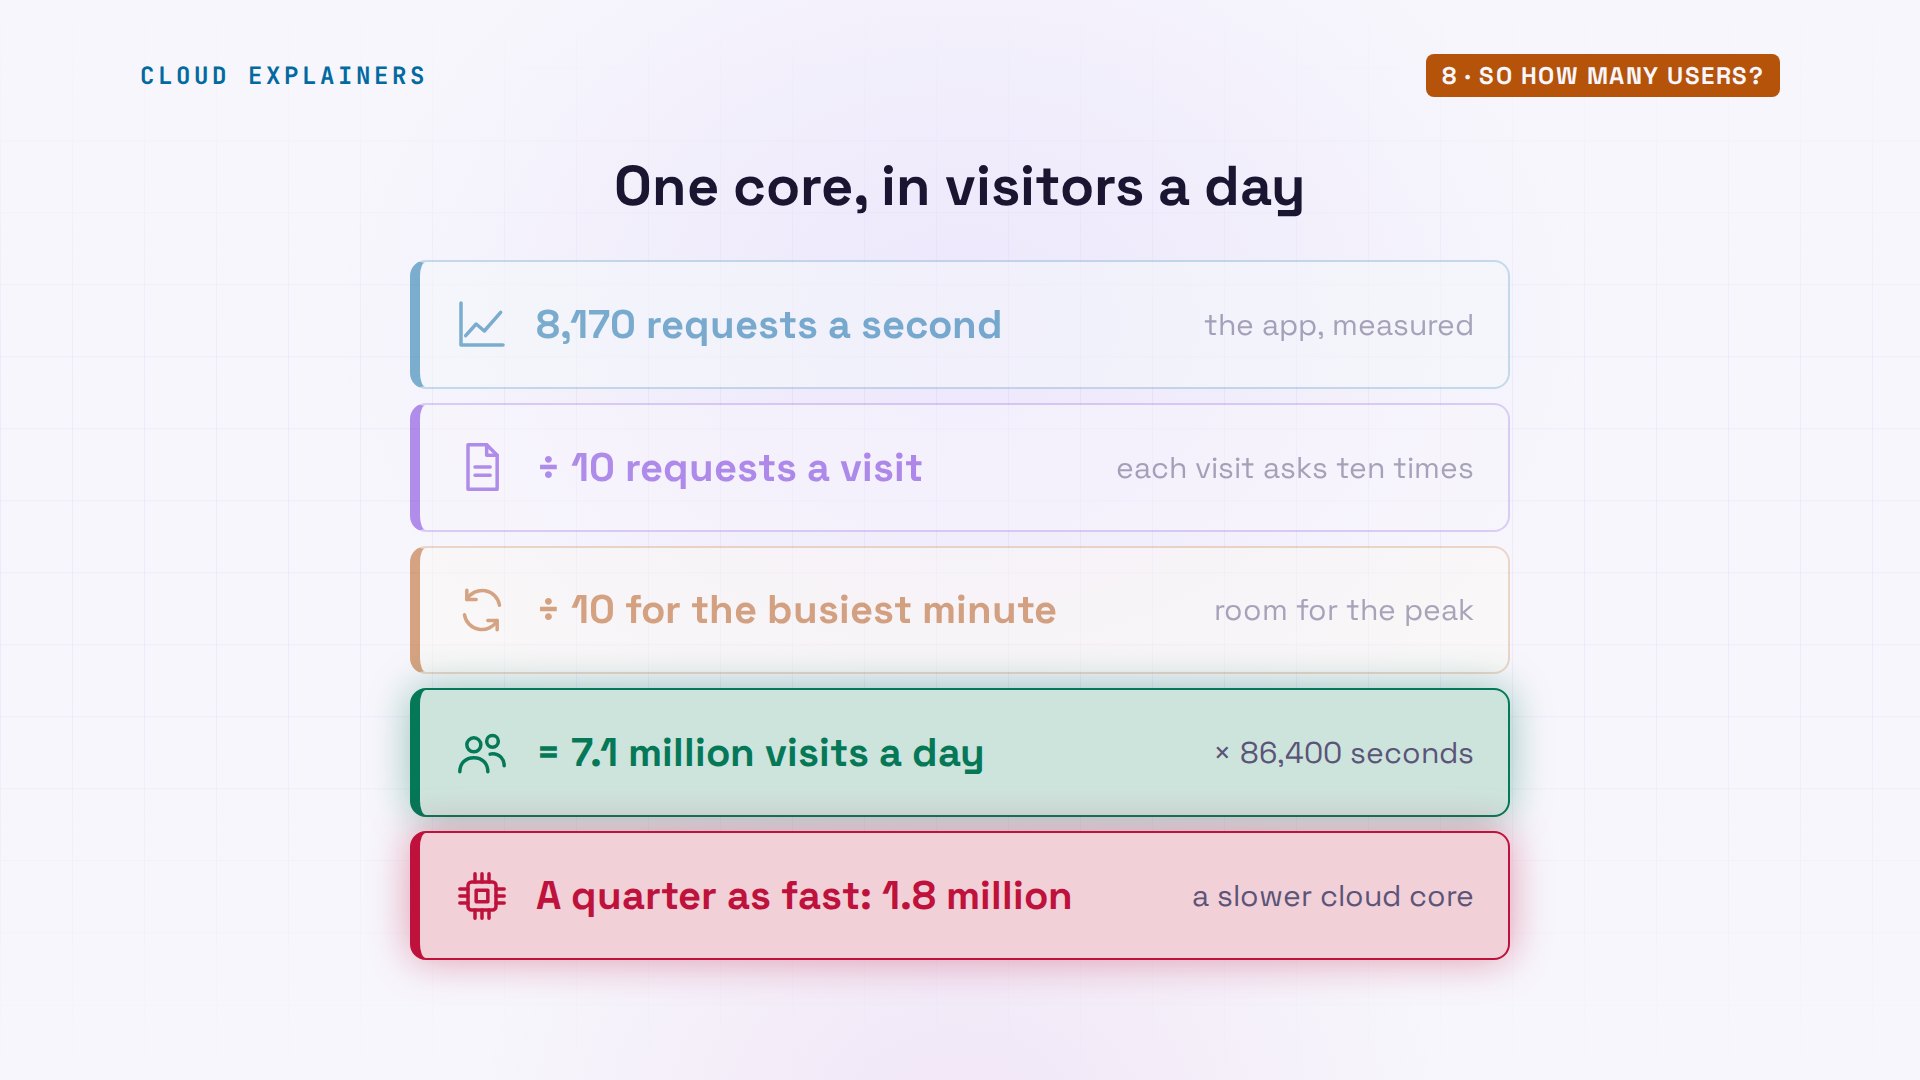
So how many visitors could one core serve the market? Take the app's measured eight thousand a second, Python and database included. With ten requests a visit, and a busiest minute ten times the average, that's about seven point one million visits a day. Our core is a fast laptop core, and a cheap cloud core is often slower. If yours manages a quarter of this, that's still about one point eight million.
Here's everything this one core did. The numbers that fell weren't the core's fault: a missing index that forced a scan, and workers stuck waiting. So before you buy a bigger server, measure with a load tester, and fix the slowest step first.
When you do need more
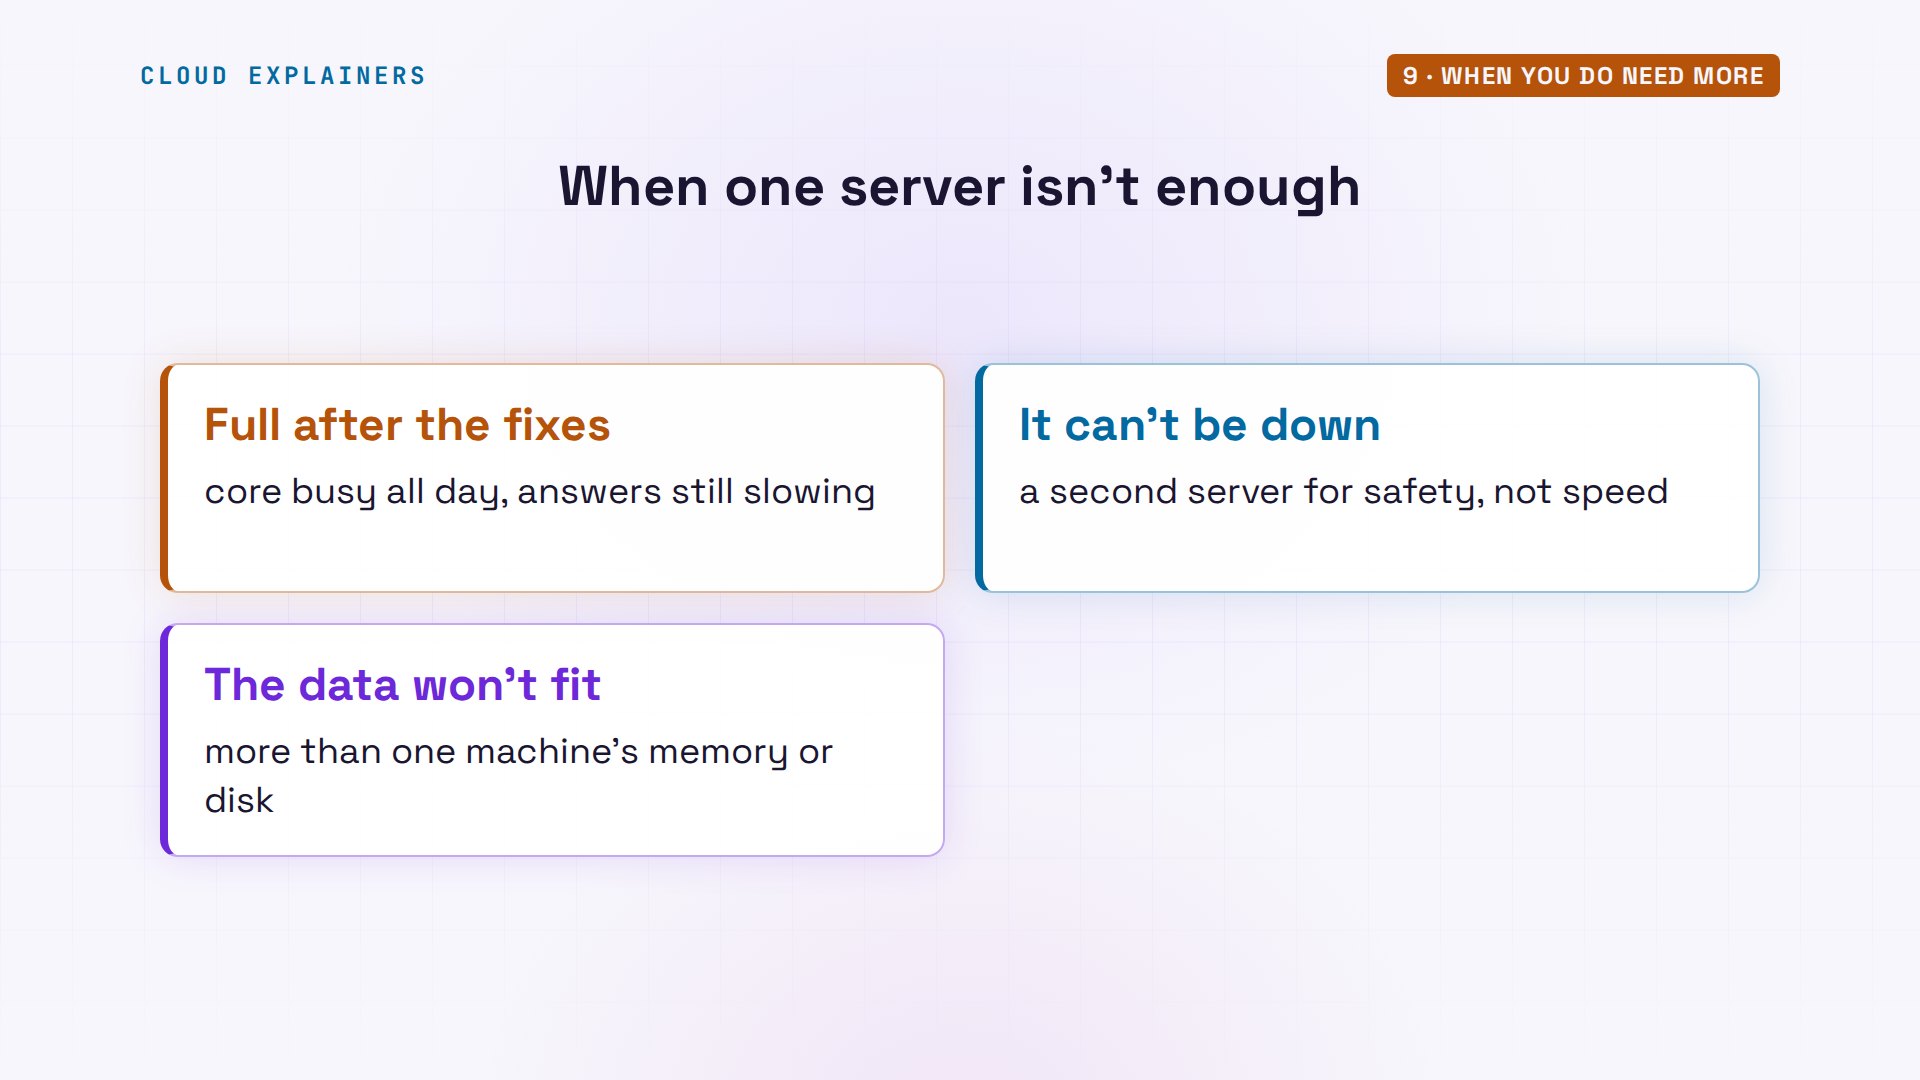
So when does the market need more than one server? When its one core stays busy all day even after the fixes, and answers keep slowing. When the site can't be down: a second server is there for when the first one fails, for safety, not speed. And when the data no longer fits in one machine's memory or storage.
Recap
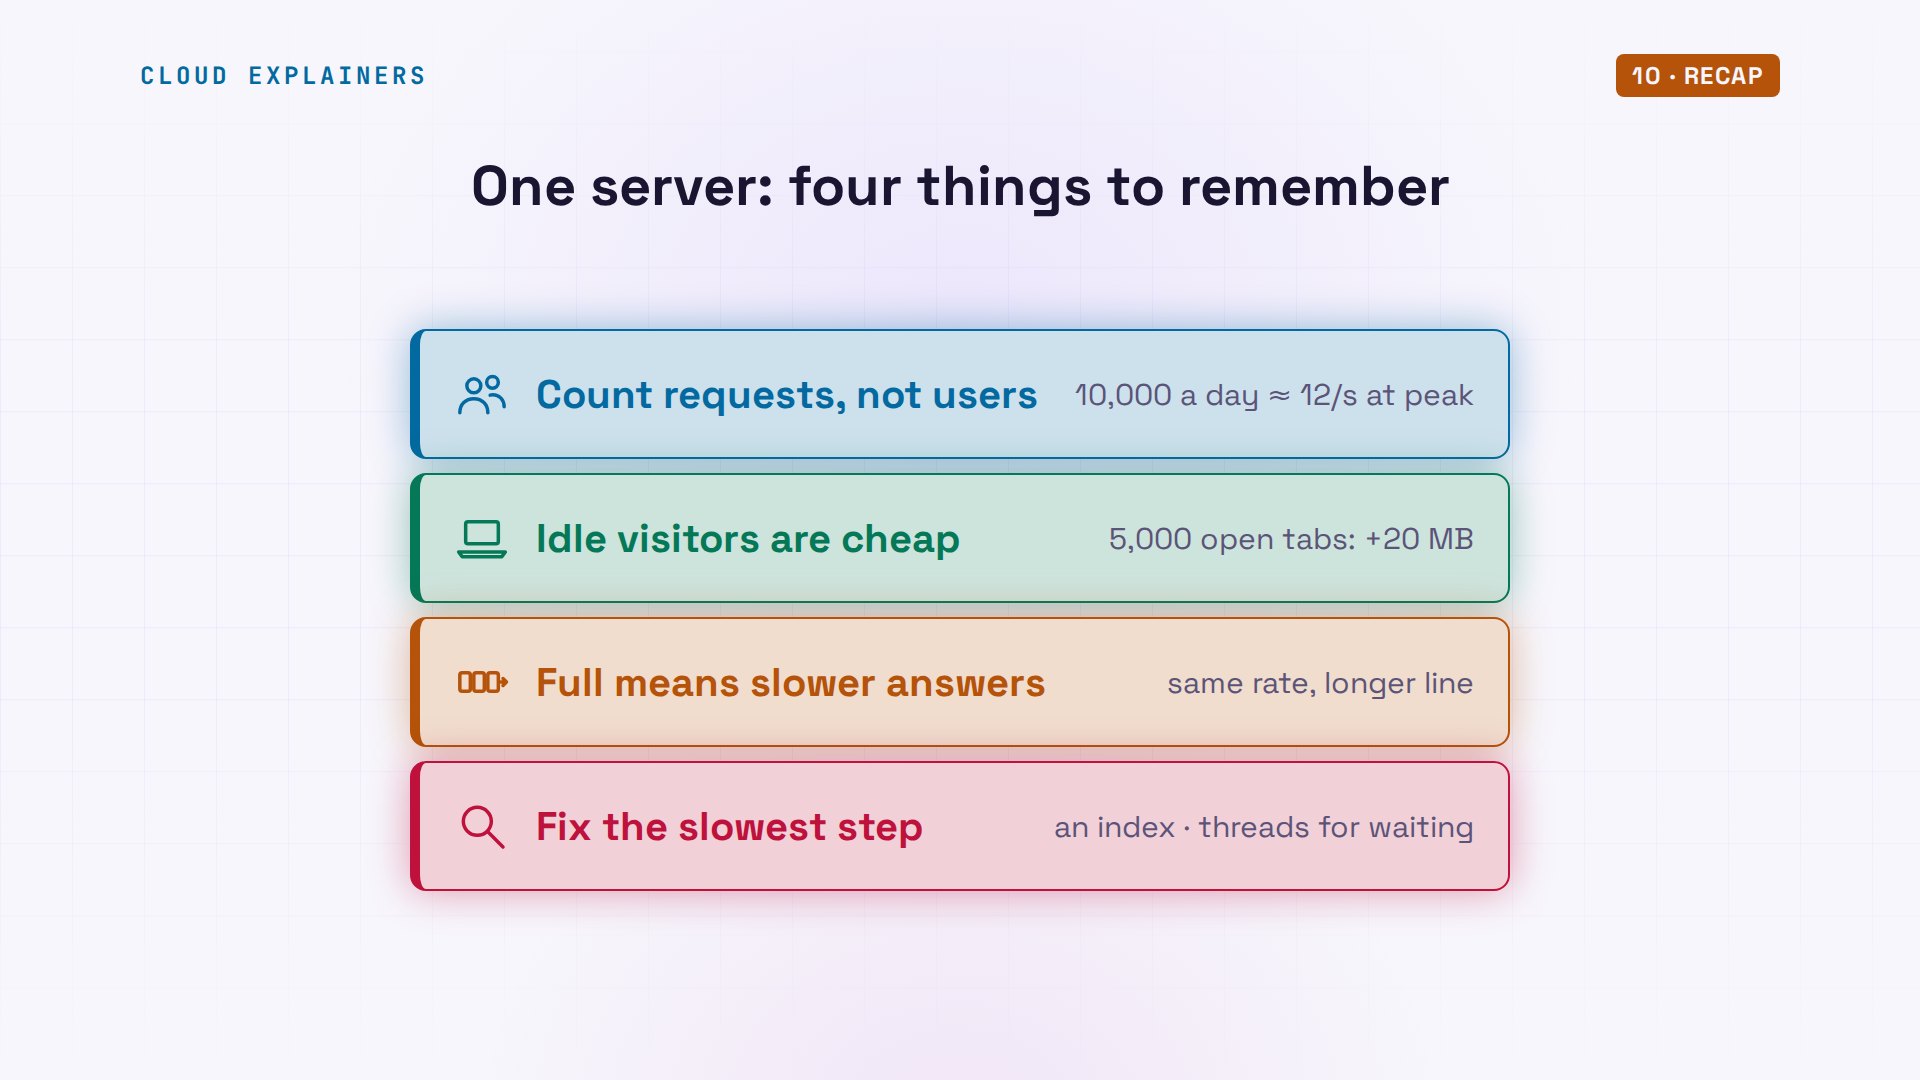
So: count requests, not users. Idle visitors cost almost nothing. A full server answers slower, and the limit is usually the slowest step: a scan of a whole table, or a wait on another service.
If this saved you from planning a cluster too soon, a like helps YouTube show this to more beginners, and subscribing brings more real measurements like these.
Every number here came from three real Ubuntu machines in our lab, and every command and the lab files are linked in the description. Thanks for watching Cloud Explainers.
Sources
- wrk, the HTTP load tester (each connection sends its next request when the answer arrives)
- Gunicorn design page, How Many Workers? (workers are not clients; (2 x CPU cores) + 1) and How Many Threads?
- Gunicorn 20.1.0 settings, threads (more than 1 with the sync worker uses gthread)
- SQLite, EXPLAIN QUERY PLAN (SCAN reads the whole table; SEARCH uses an index)
- ss(8), -s: socket summary
- nproc(1): the number of processing units available
Demos: three containers on our own Mac standing in for a farmers market's server, a card payment service and Ana's laptop; the market and its customers are made up. Every request and number was measured. Watch the full video on YouTube.
More videos

DevOps with Ansible Will Finally Make Sense After This

How SNMP Network Monitoring Works

How to Fix GitHub 'Permission Denied (publickey)' Errors
How to Fix PostgreSQL 'Password Authentication Failed'

How to Fix Network 'Connection Refused' Errors
DevOps Pipelines: Jenkins vs GitHub Actions
Every Networking Term a Beginner Needs in 12 Minutes

How to Fix Docker 'Permission Denied' on docker.sock
How to Fix Git 'Updates Were Rejected' When You Push
How to Fix nginx 502 Bad Gateway Errors on Linux
How to Fix Linux apt 'Could Not Get Lock' Errors (Ubuntu)

How Email Works on the Internet (SMTP) in 10 Minutes

The Python Roadmap for Beginners

Golang REST API with Gin: Full Tutorial for Beginners

How a WireGuard VPN Network Works

Linux Makefiles Will Finally Make Sense After This

SAML vs OAuth vs OpenID Connect: What's the Difference?
How to Fix Python cron Jobs That Never Run

Linux Bash Scripting: Full Tutorial for Beginners
How PXE Network Boot Works

How Active Directory Works

How to Fix a Linux systemd Service That Won't Start
Linux Logs: syslog vs journald
JWT vs Session Cookies: Which One Should You Use?
Docker vs Docker Compose: Which One Should You Use?

How to Fix Docker Compose Containers That Can't Talk to Each Other

Django Full Tutorial for Beginners

How Linux systemd Works

How to Fix 'Windows Cannot Access' Network Share Errors (SMB)
REST vs gRPC: Which One Should You Use?
How to Fix SSL Certificate Chain Errors (Missing Intermediate)

Every Python Concept for Beginners in 10 Minutes

Every SQL Join Type in 10 Minutes
Why OpenRouter Free Models Hit Their Limit So Fast
Why Your Gemini API Free Tier Runs Out So Fast

OpenRouter Will Finally Make Sense After This
How Redis Caching Works
Gemini API vs Vertex AI: Which One Should You Use?

How to Fix a Leaked Gemini API Key
Why Golang Uses Goroutines Instead of Threads
How to Fix Gemini API Error 429: Resource Exhausted

Claude Token Pricing Will Finally Make Sense After This
Why Python Web Scraping Returns Nothing (and the Fix)
Python uv vs pip: Which One Should You Use?

Python Automation: Full Tutorial for Beginners

How OAuth Login Works

Google AI Studio Will Finally Make Sense After This
What Happens When You Run a Docker Container

How to Fix Claude Code Billing Your API Key Instead of Your Plan
Why Passkeys Can't Be Phished Like Passwords
PowerShell vs Bash: Which One Should You Learn?

The Linux Roadmap for Beginners
Django vs FastAPI: Which One Should You Use?

Why SQLite Is the Most Used Database in the World
How a NoSQL Database Like MongoDB Works

How to Fix Python pip error: externally-managed-environment
How to Fix MySQL Too Many Connections Database Errors
Golang Concurrency Will Finally Make Sense After This
How Amazon S3 Works
How Kubernetes Works

How Git Works
How to Fix Docker Port Already Allocated Errors
How PostgreSQL Works

How to Fix Git Merge Conflicts

How to Fix No Space Left on Device in Linux
How the Internet Works
SQL vs NoSQL: When Each One Wins
How to Fix JWT Token Expired Errors (401 Unauthorized)
Claude API vs Claude Pro: Why Your Subscription Doesn't Include It

Why AI Agent Skills Beat Giant Prompts

Linux Cron Jobs Will Finally Make Sense After This

Security Logs Will Finally Make Sense After This

How to Fix a Security Leak: An API Key Pushed to GitHub
DNS Will Finally Make Sense After This
Never Ignore a Security Update
Two-Factor Authentication Will Finally Make Sense
Never Expose a Database to the Internet
SSH Keys vs Passwords: Which Is Safer for Security?

The 5 Levels of Linux Boot: From Power On to Login
The 5 Levels of Network Firewalls

Password Security: Why Hackers Crack Weak Passwords
Why Your Linux Server Runs Out of Memory
HTTP vs HTTPS: What Actually Changes on Your Network

Every Linux File Permission You Need to Know
Linux Processes vs Threads: When Each One Wins

The OSI Model Will Finally Make Sense After This

The 7 Levels of Git
Every Network Troubleshooting Command You Need
Hashing vs Encryption in Cybersecurity: When Each One Wins
Why the Internet Ran Out of IP Addresses
Linux Package Managers: apt vs Snap vs Flatpak

Why Python Is Slow (and When It Doesn't Matter)
TCP vs UDP: When Each One Wins

Stop Running Linux as Root (Do This Instead)

Linux Users and Groups Will Finally Make Sense

Why Phishing Beats Good Security (and How to Spot It)

The 7 Levels of Docker

AI Agents Will Finally Make Sense After This

Stop Using git push --force (Use This Instead)
Agent Skills vs MCP: When Each One Wins

Networking Will Finally Make Sense After This

Every Linux Command You Actually Need
The 7 Levels of Cybersecurity

Every System Design Concept You Need, in One Diagram