How PostgreSQL Works
How PostgreSQL works, for beginners, proven on a real PostgreSQL 18 server: an order saved one moment before the server is killed comes back after the restart, and we follow why through every part inside: one backend process per connection, the planner choosing between a sequential scan and an index from its statistics, 8 kB pages in shared buffers (read vs hit), the write-ahead log and checkpoints that make crash recovery work, and MVCC row versions cleaned up by VACUUM.
Saved, then a crash
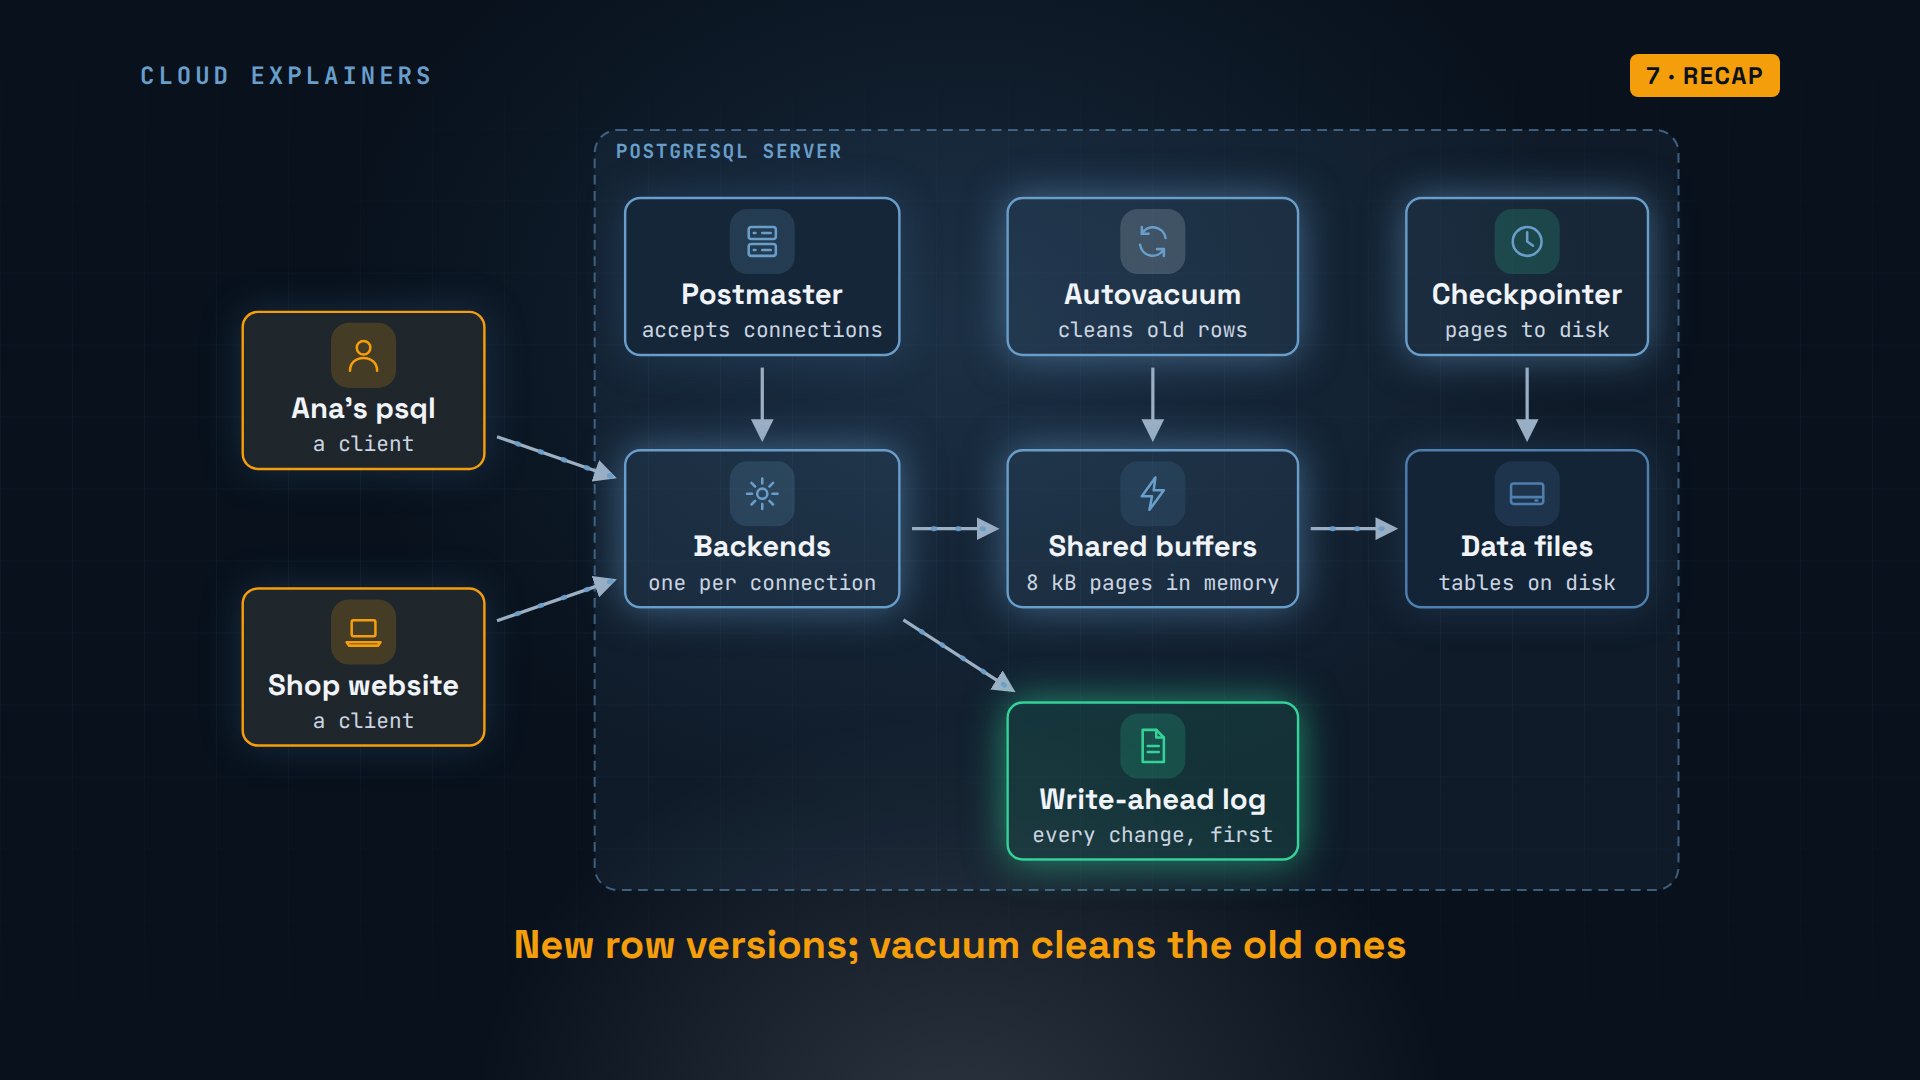
When you save something in PostgreSQL and the server crashes a moment later, is it still there? Here's Ana's tea shop. She saves a new order, and less than a second later, the database server is killed. By the end, you'll know exactly what happens when it starts again, and you'll have seen the parts inside PostgreSQL that every query passes through.
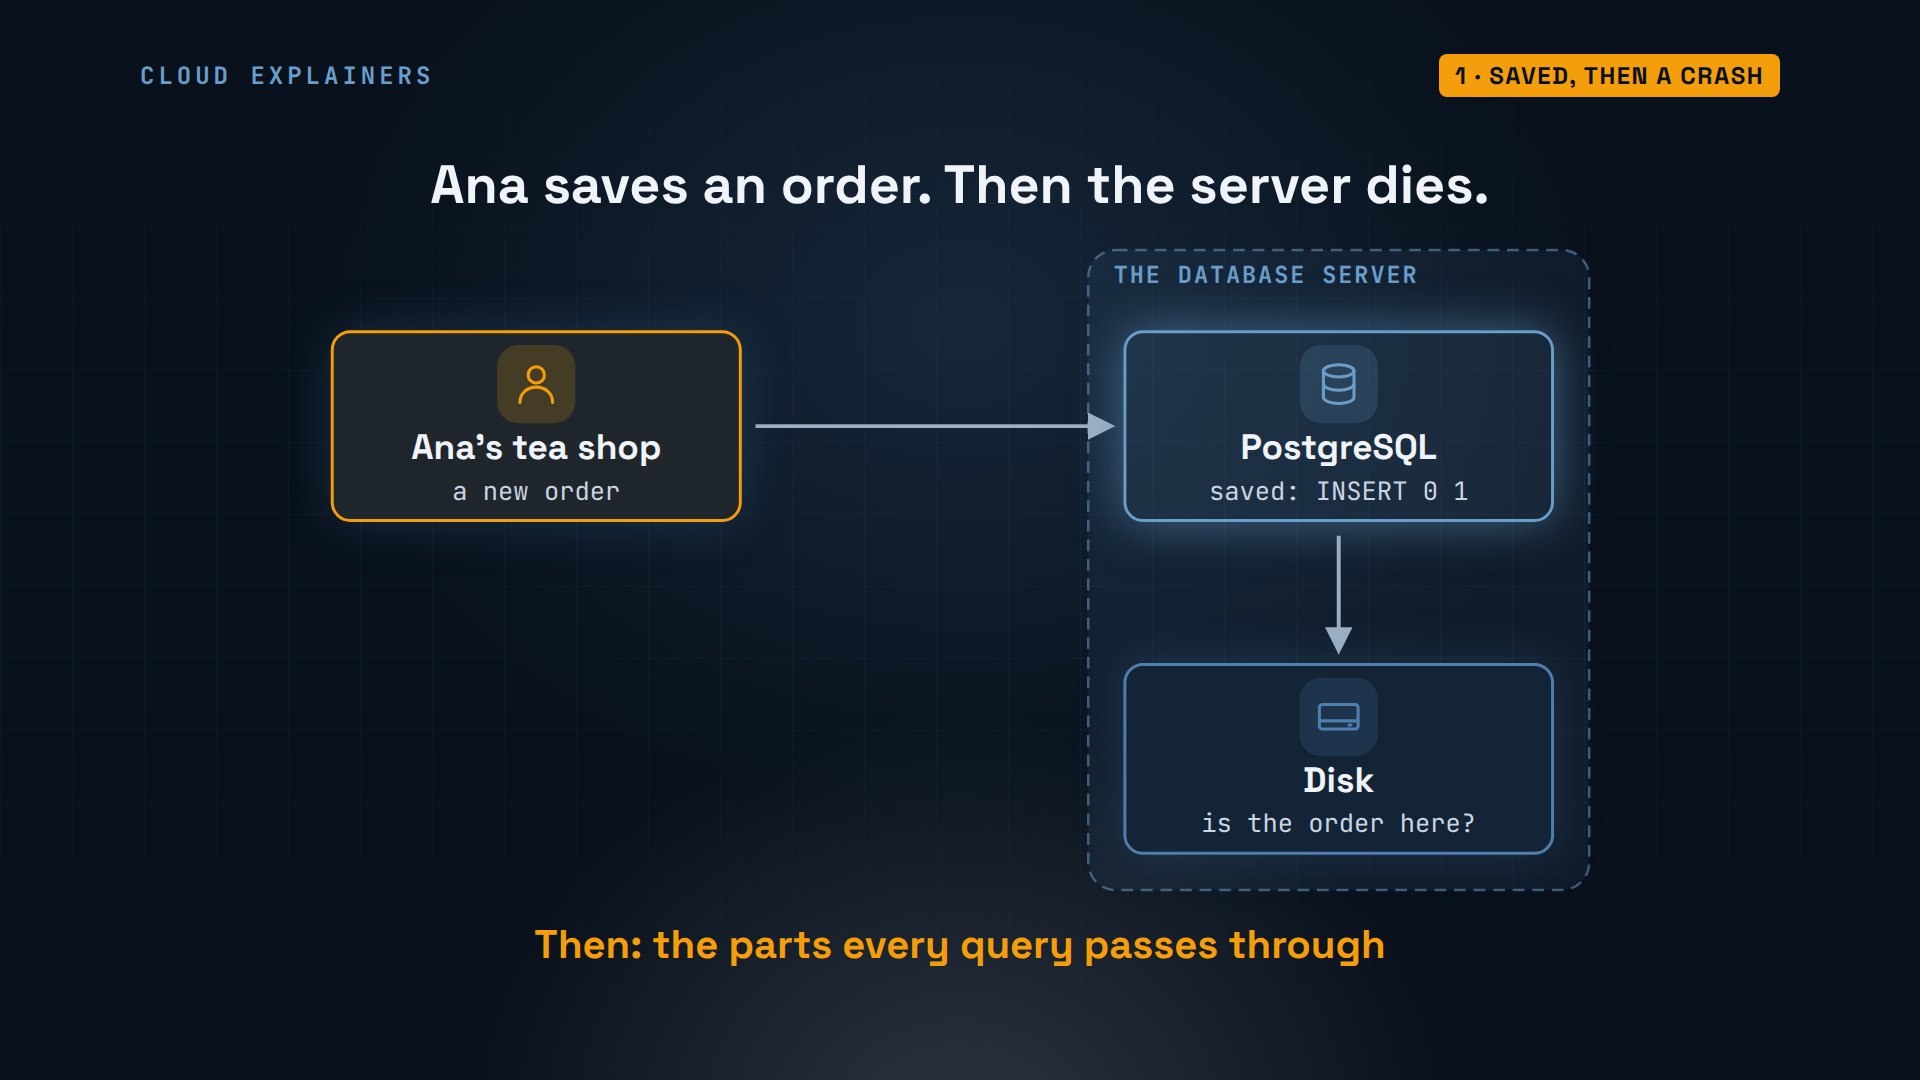
She adds order 200001 for customer 42. PostgreSQL answers insert, zero, one: saved. Then we kill every PostgreSQL process at once, with no chance to tidy up. Her next query: the server closed the connection. We start it again, and the order is there.
shop=# INSERT INTO orders (customer_id, product_id, qty) VALUES (42, 1, 2) RETURNING id;id -------- 200001 (1 row) INSERT 0 1
shop=# SELECT id, qty FROM orders WHERE id = 200001;server closed the connection unexpectedly
	This probably means the server terminated abnormally
	before or while processing the request.
The connection to the server was lost. Attempting reset: Failed.
The connection to the server was lost. Attempting reset: Failed.
shop=# SELECT id, customer_id, qty, status FROM orders WHERE id = 200001;id | customer_id | qty | status --------+-------------+-----+-------- 200001 | 42 | 2 | new (1 row)
It wasn't luck. Committed data in PostgreSQL survives crashes by design. To see how, we'll follow one database through its parts: the processes, the planner, the memory, the log, and the row versions.
A process per connection
A PostgreSQL server is a family of programs. The first, the postmaster, waits for connections. When a client connects, like Ana's psql or the shop's website, the postmaster starts a new process just for it, called a backend. That backend does all the work for its one connection: it reads each query, plans it, runs it, and sends back the rows.
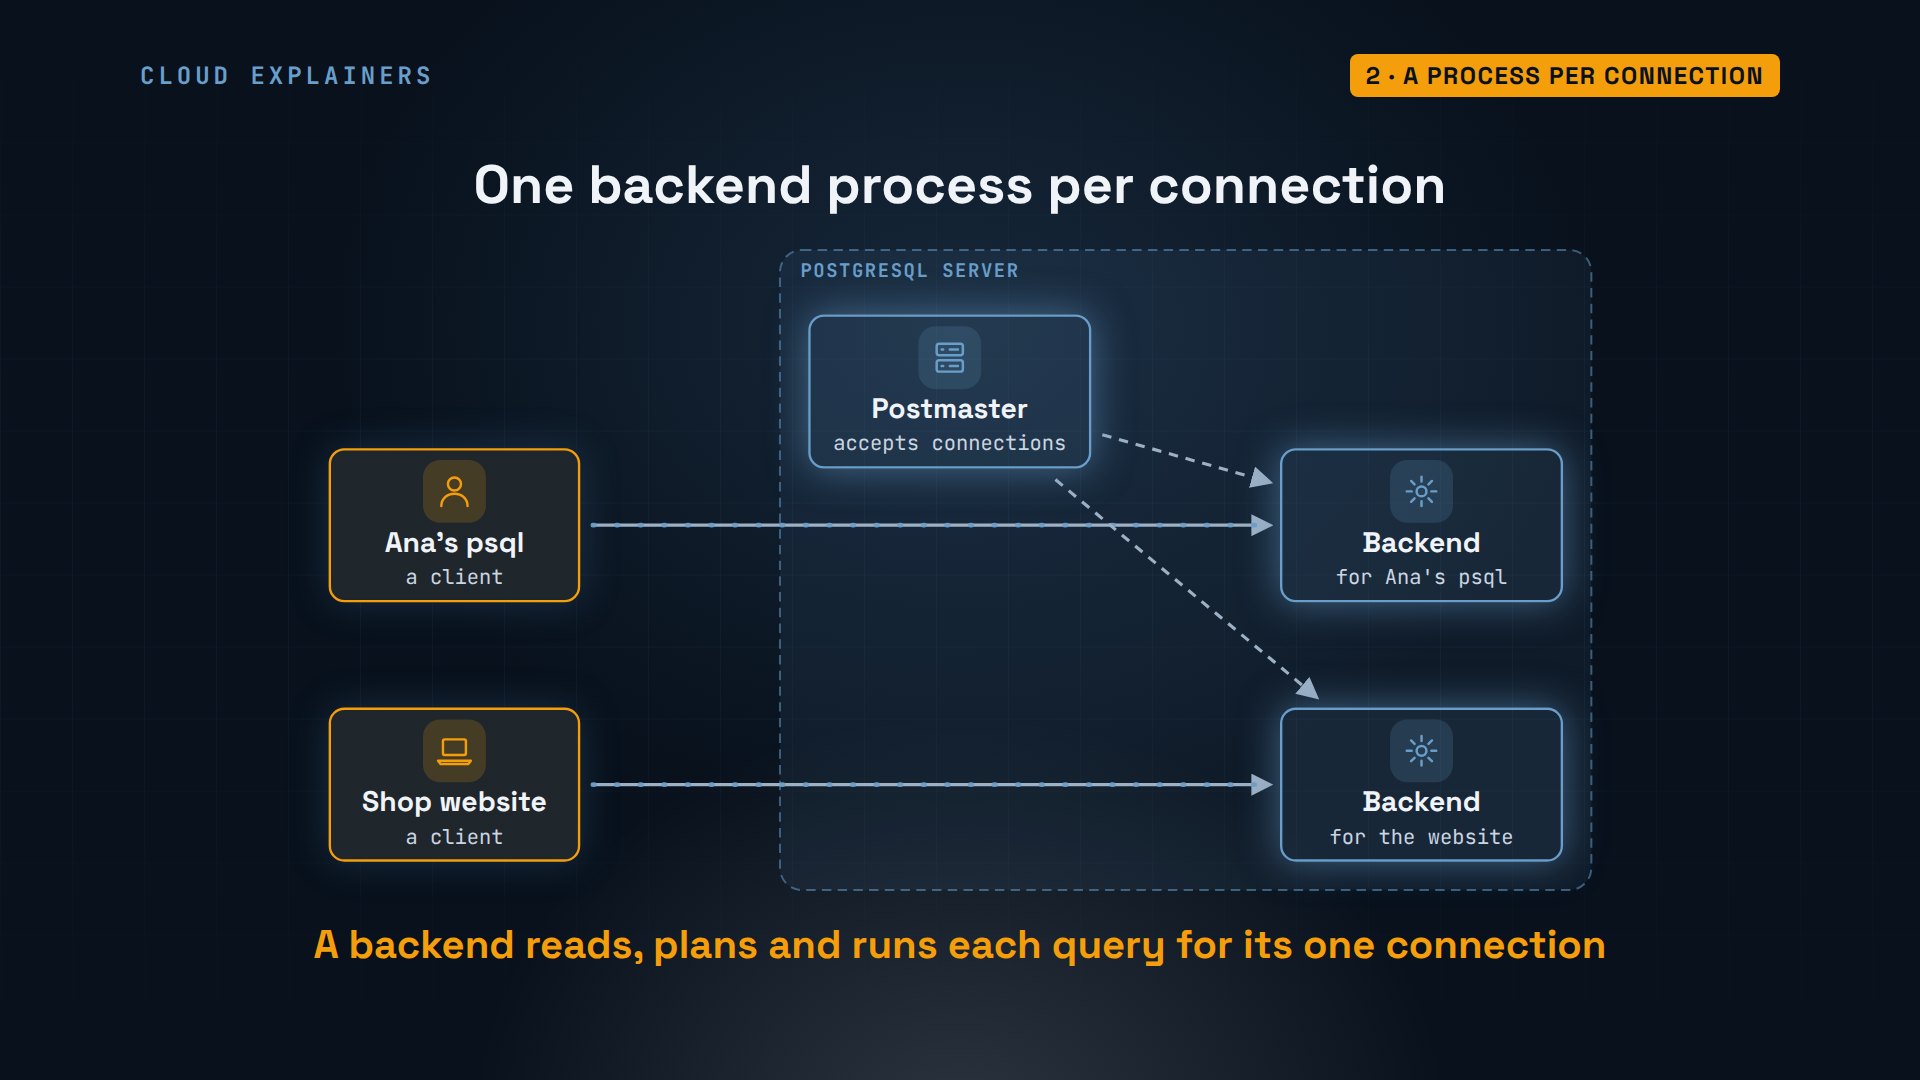
Everything here is a real PostgreSQL 18.6 server, in a container on our lab machine. Ana's session asks for its backend's process ID: 50. The website's connection has its own: 51. The server's activity view lists them both as client backends, next to helpers that run in the background: the checkpointer, the background writer, the WAL writer, the autovacuum launcher, and 3 I/O workers that read data files.
shop=# SELECT pg_backend_pid();pg_backend_pid ---------------- 50 (1 row)
shop=# SELECT pg_backend_pid();pg_backend_pid ---------------- 51 (1 row)
shop=# SELECT pid, backend_type FROM pg_stat_activity ORDER BY backend_type, pid;pid | backend_type -----+------------------------------ 41 | autovacuum launcher 37 | background writer 36 | checkpointer 50 | client backend 51 | client backend 33 | io worker 34 | io worker 35 | io worker 42 | logical replication launcher 40 | walwriter (10 rows)
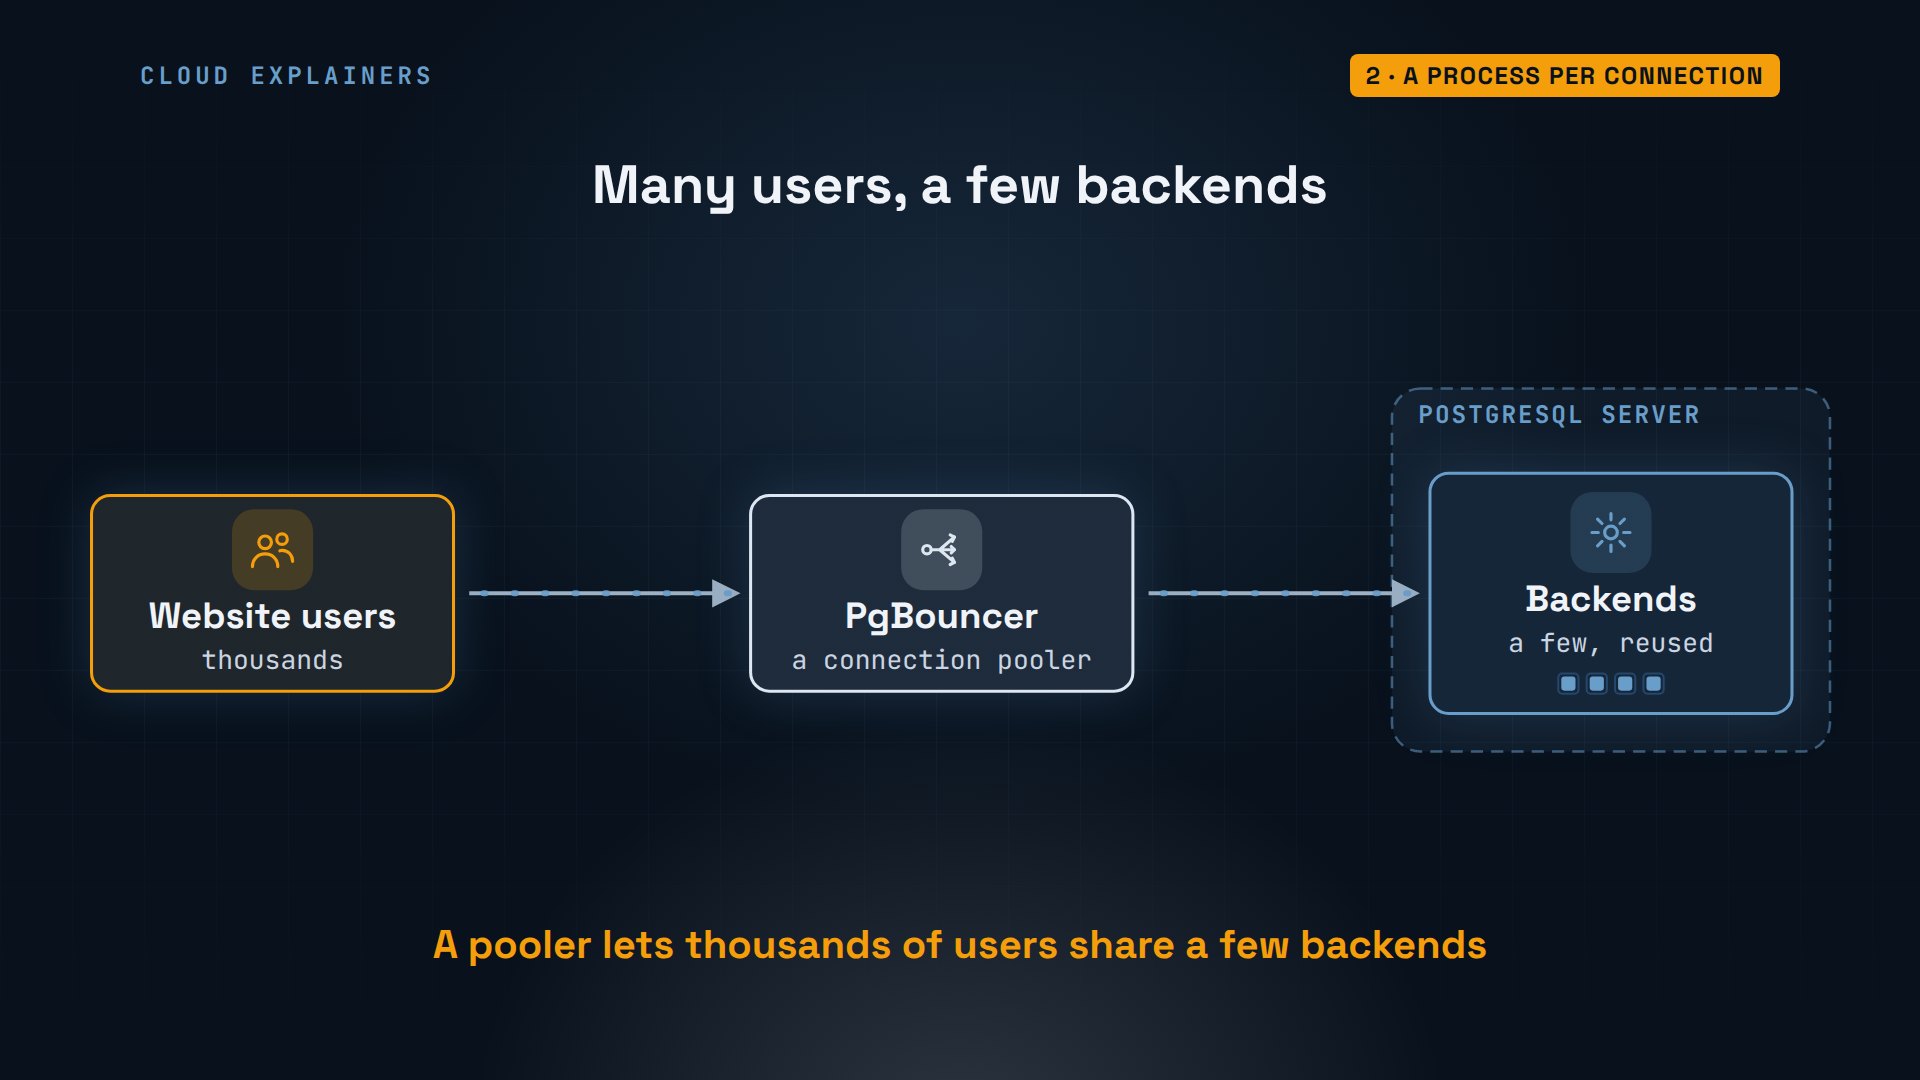
A process per connection is simple and sturdy, but each one costs memory and time to start. So the default limit is 100 connections, and busy apps put a connection pooler, like PgBouncer, in front: thousands of users share a few backends, each one reused again and again.
The planner
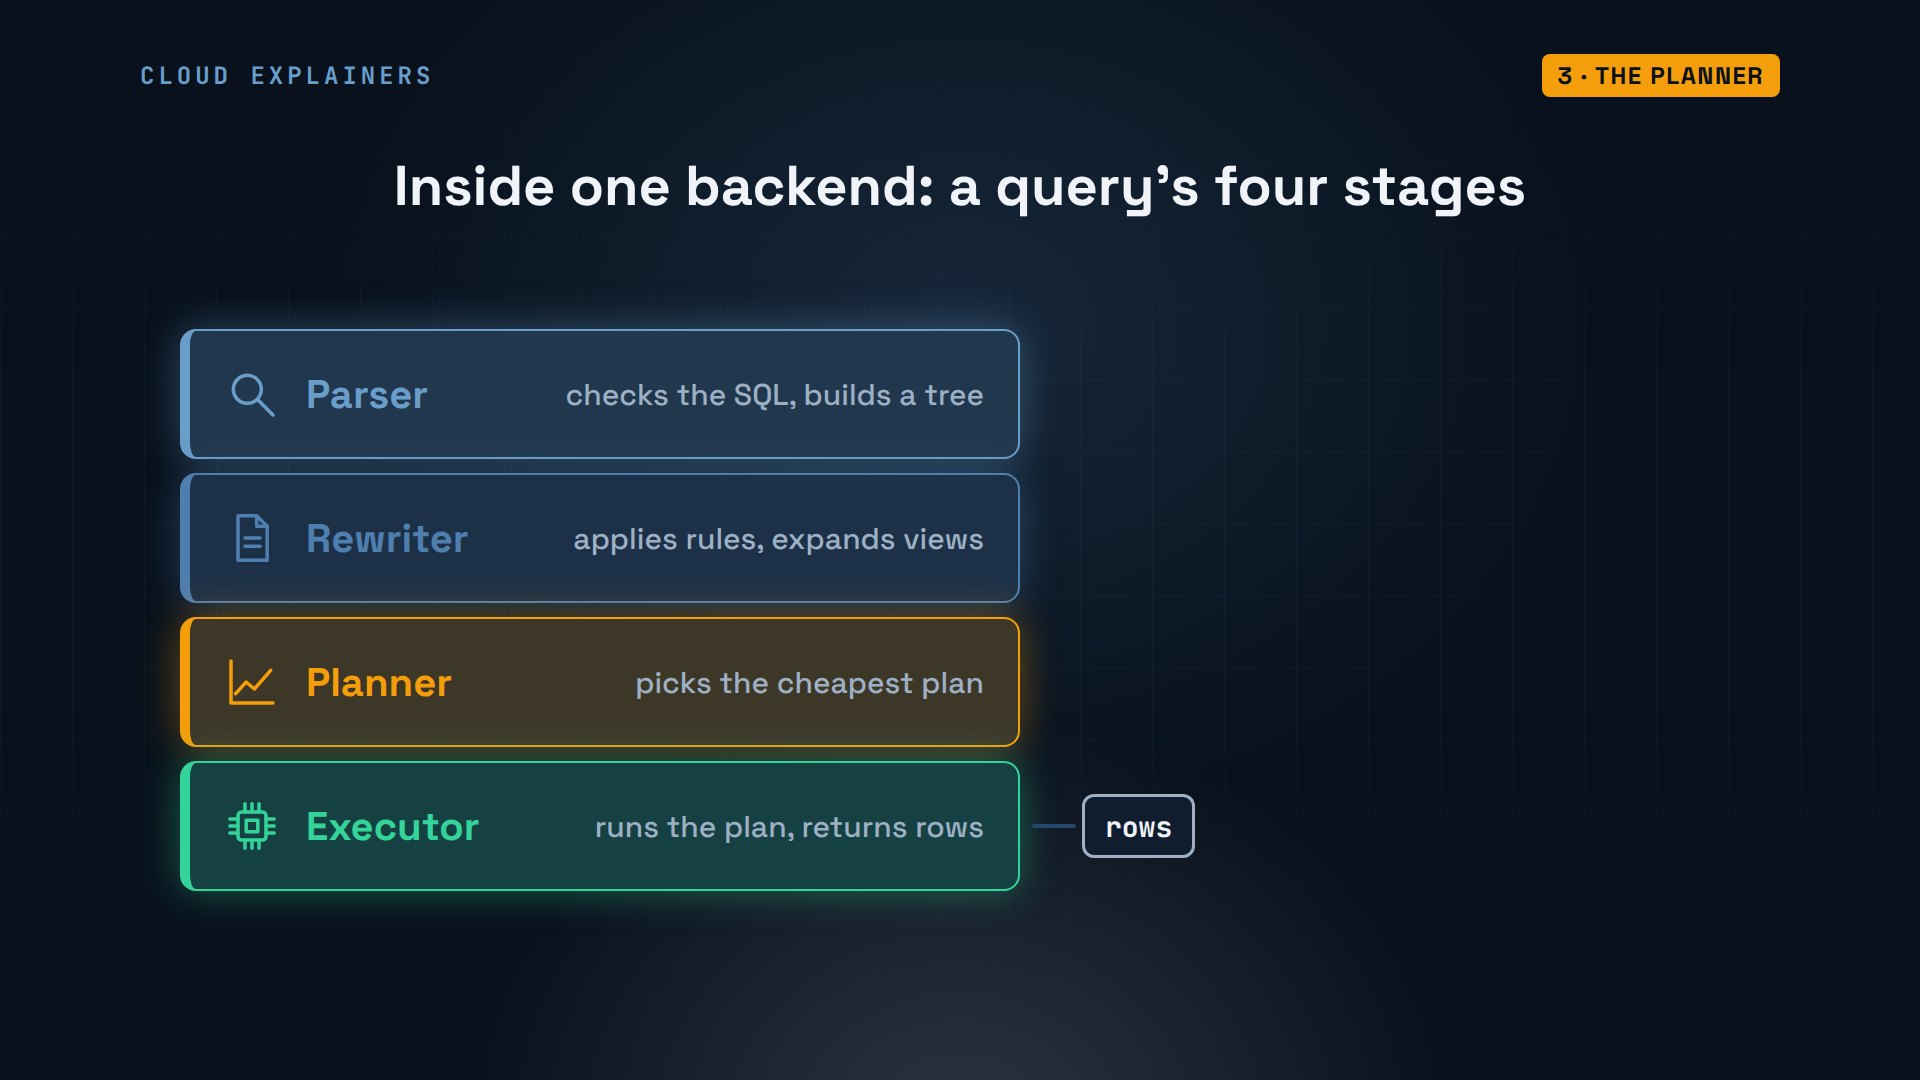
Inside a backend, every query goes through four stages. The parser checks the SQL and turns it into a tree. The rewriter applies rules, like expanding views. The planner works out the cheapest way to get the rows. And the executor runs that plan, fetching pages and returning rows.
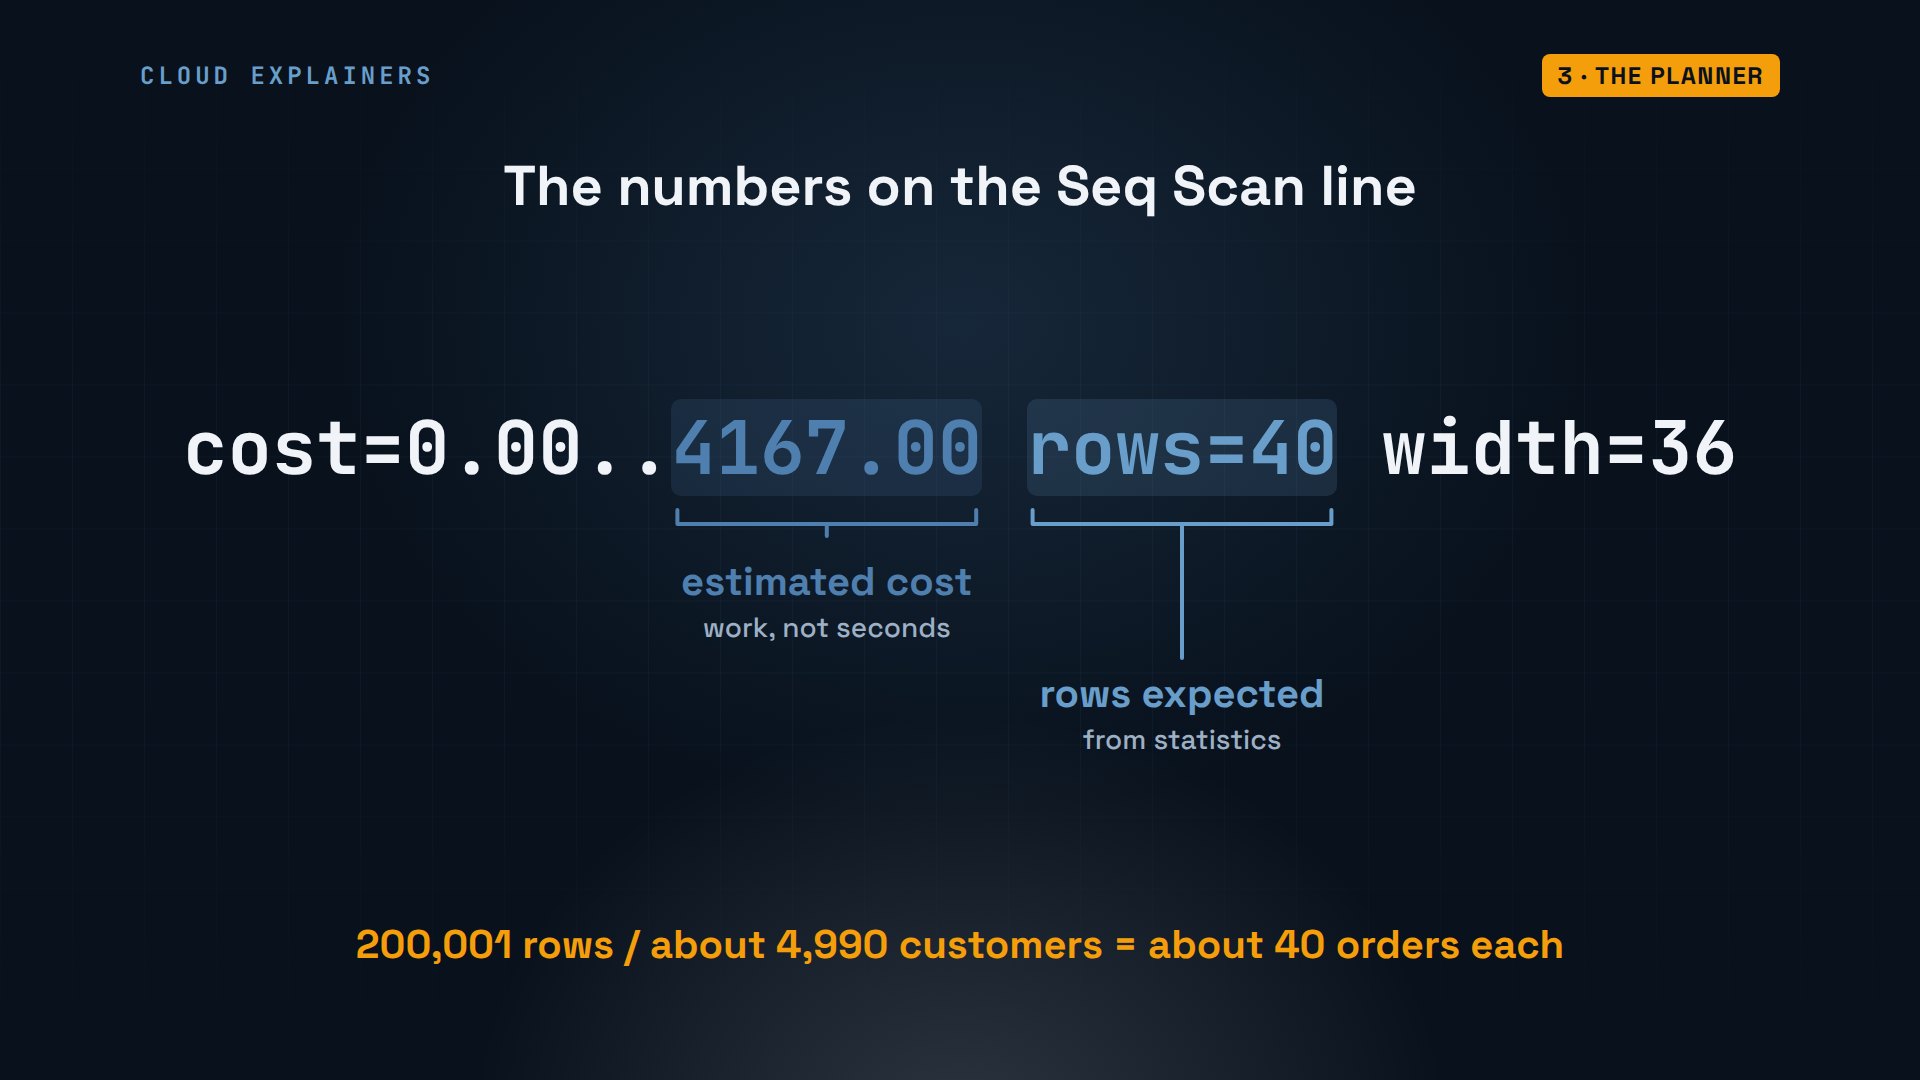
Ana's orders table has 200,001 rows. She asks for customer 42's orders, with EXPLAIN in front, so PostgreSQL shows its plan instead of running it. Seq scan: read the whole table, row after row. Estimated cost: 4,167, and it expects 40 rows.
shop=# EXPLAIN SELECT * FROM orders WHERE customer_id = 42;QUERY PLAN ----------------------------------------------------------- Seq Scan on orders (cost=0.00..4167.00 rows=40 width=36) Filter: (customer_id = 42) (2 rows)
Where does 40 come from? PostgreSQL keeps statistics on every column. It knows the customer column holds about 4,990 different customers, so one customer has about 40 orders. And cost isn't seconds: it's PostgreSQL's own measure of work, mostly pages to read and rows to check.
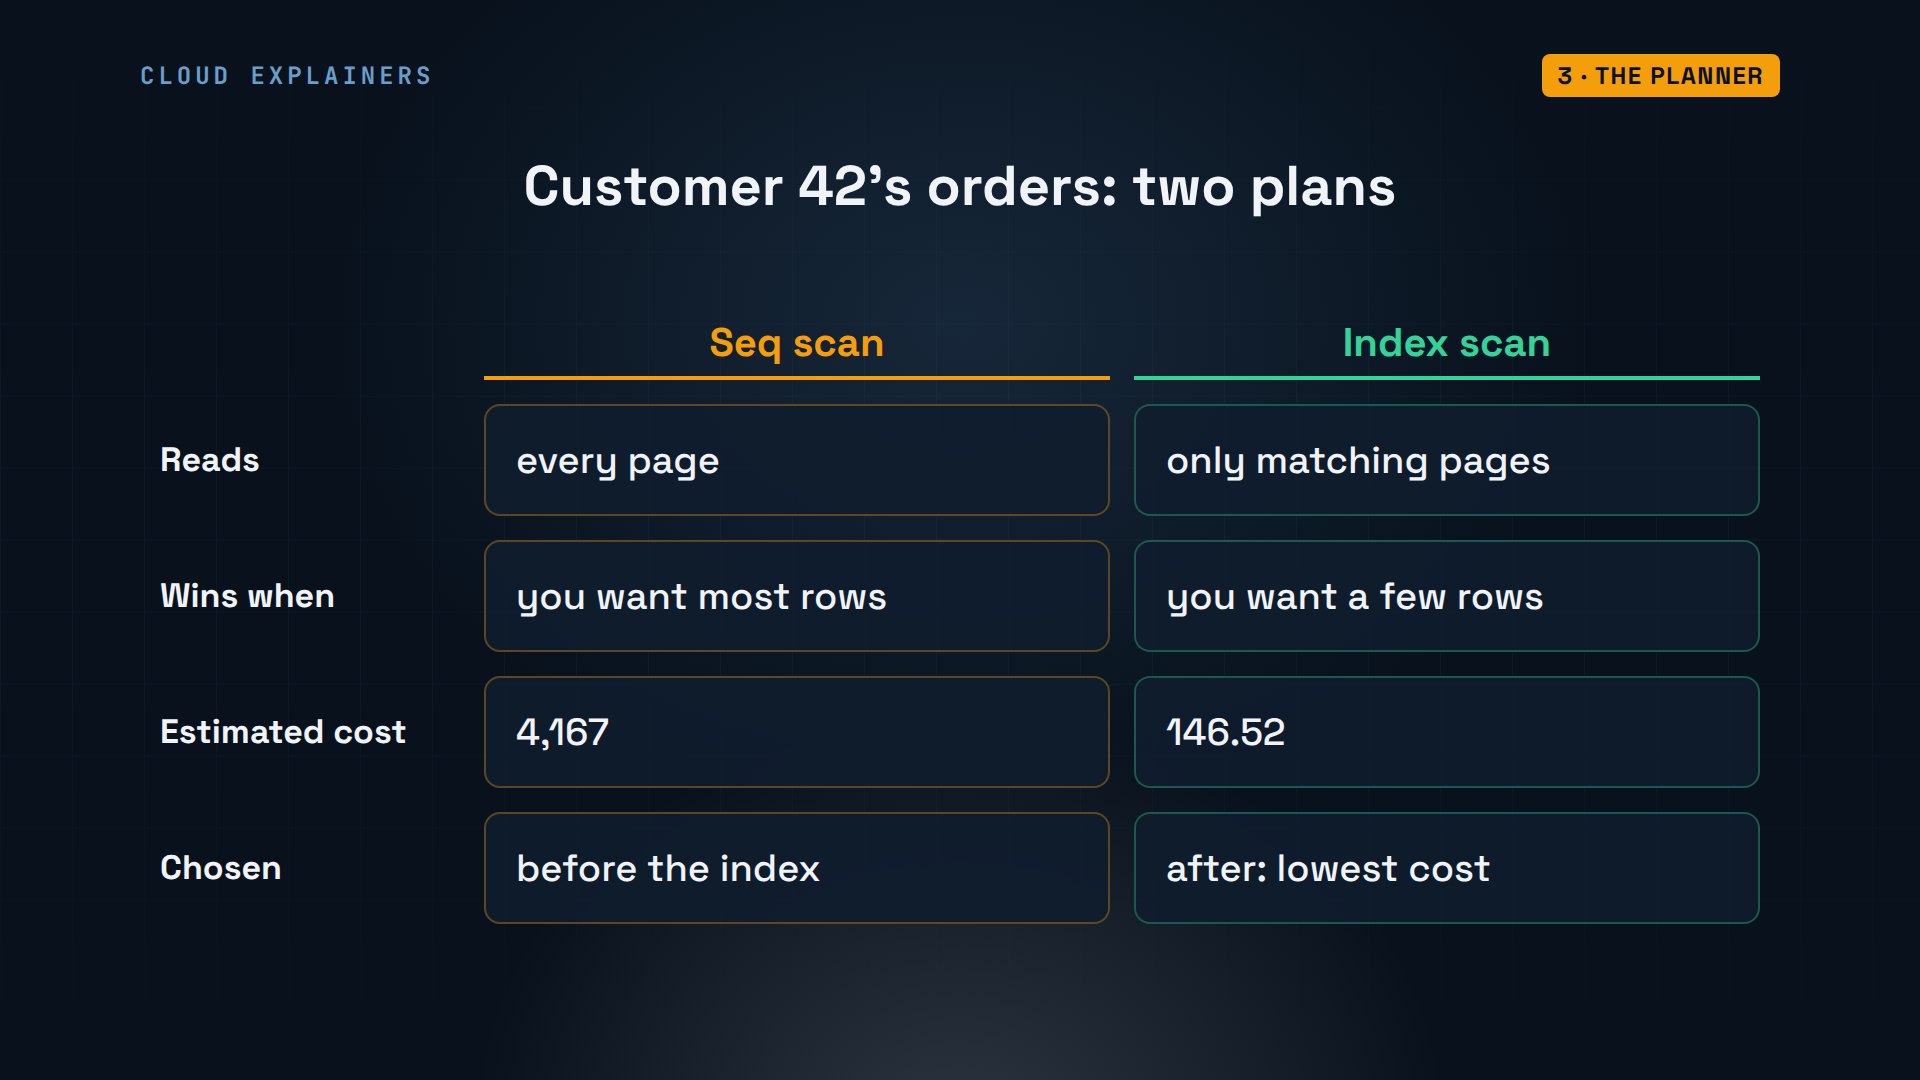
Now Ana adds an index on the customer column: a sorted list of customer numbers, each pointing to where its rows are. Same question, new plan: the index finds the matching rows, then PostgreSQL reads just their pages. Estimated cost: 147, down from 4,167. The real answer: 42 orders.
shop=# CREATE INDEX orders_customer_idx ON orders (customer_id);CREATE INDEX
shop=# EXPLAIN SELECT * FROM orders WHERE customer_id = 42;QUERY PLAN ----------------------------------------------------------------------------------- Bitmap Heap Scan on orders (cost=4.60..146.52 rows=40 width=36) Recheck Cond: (customer_id = 42) -> Bitmap Index Scan on orders_customer_idx (cost=0.00..4.59 rows=40 width=0) Index Cond: (customer_id = 42) (4 rows)
shop=# SELECT count(*) FROM orders WHERE customer_id = 42;count ------- 42 (1 row)
The planner doesn't always pick the index. If Ana wanted most of the table, reading it straight through would be cheaper. It compares the estimated cost of each plan, using its statistics, and picks the lowest. Stale statistics can mislead it, so PostgreSQL refreshes them automatically.
Shared buffers
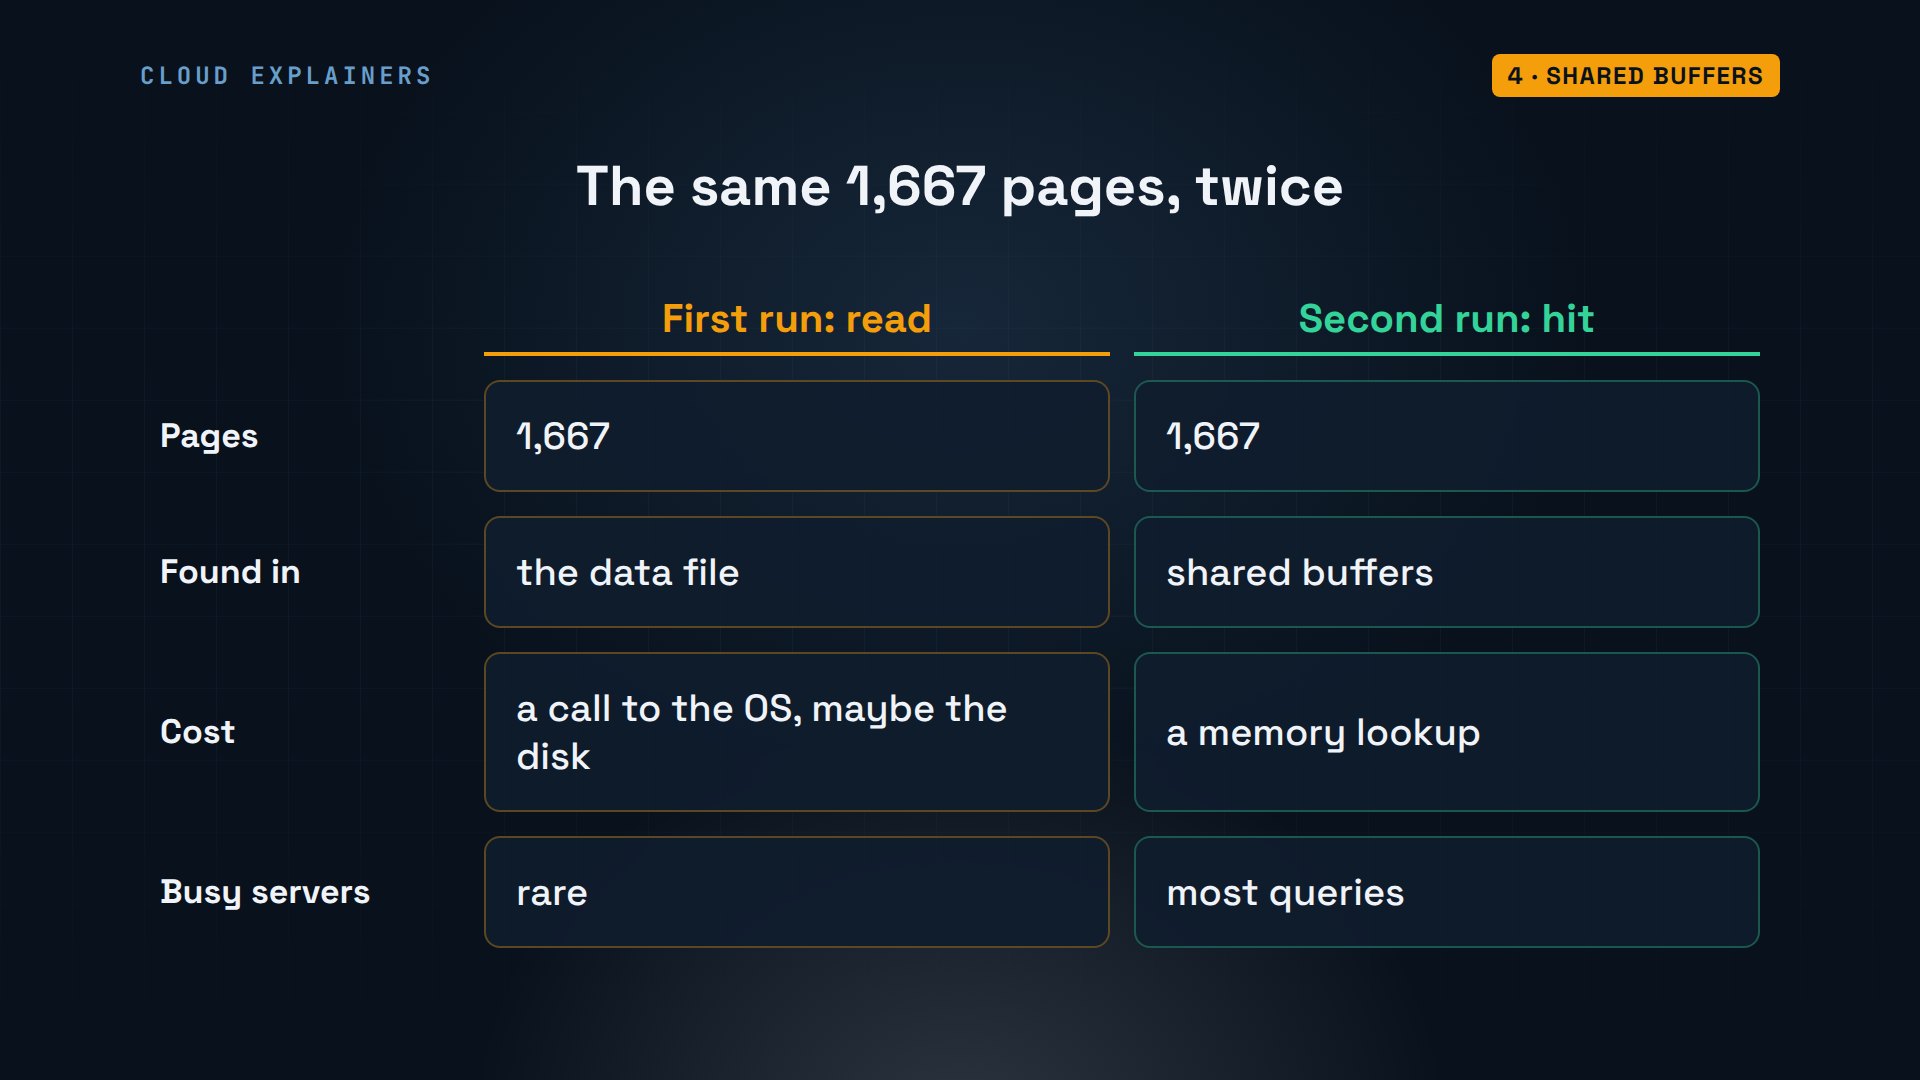
Now, where do those pages come from? PostgreSQL stores every table in pages of 8 kB. Ana's orders table is 1,667 of them. The pages in use sit in a big area of memory that every backend shares, called shared buffers. A backend looks there first, and only if the page is missing does it read it from the data file, keeping it in memory for next time.
Our server has the default 128 MB. First, we push the orders table out of shared buffers: 1,668 buffers, its 1,667 pages plus one page of a small map PostgreSQL keeps about it. Then Ana adds up every order's quantity, with EXPLAIN ANALYZE, which runs the query and counts pages. Shared read: 1,667. Every page came from the data file. Run it again: shared hit, 1,667. Every page was already in memory.
A hit is a quick look in memory. A read asks the operating system for the page, which may still have it in its own cache, or must fetch it from disk. So a busy server keeps its most used pages in shared buffers, and most queries never wait for the disk.
The write-ahead log
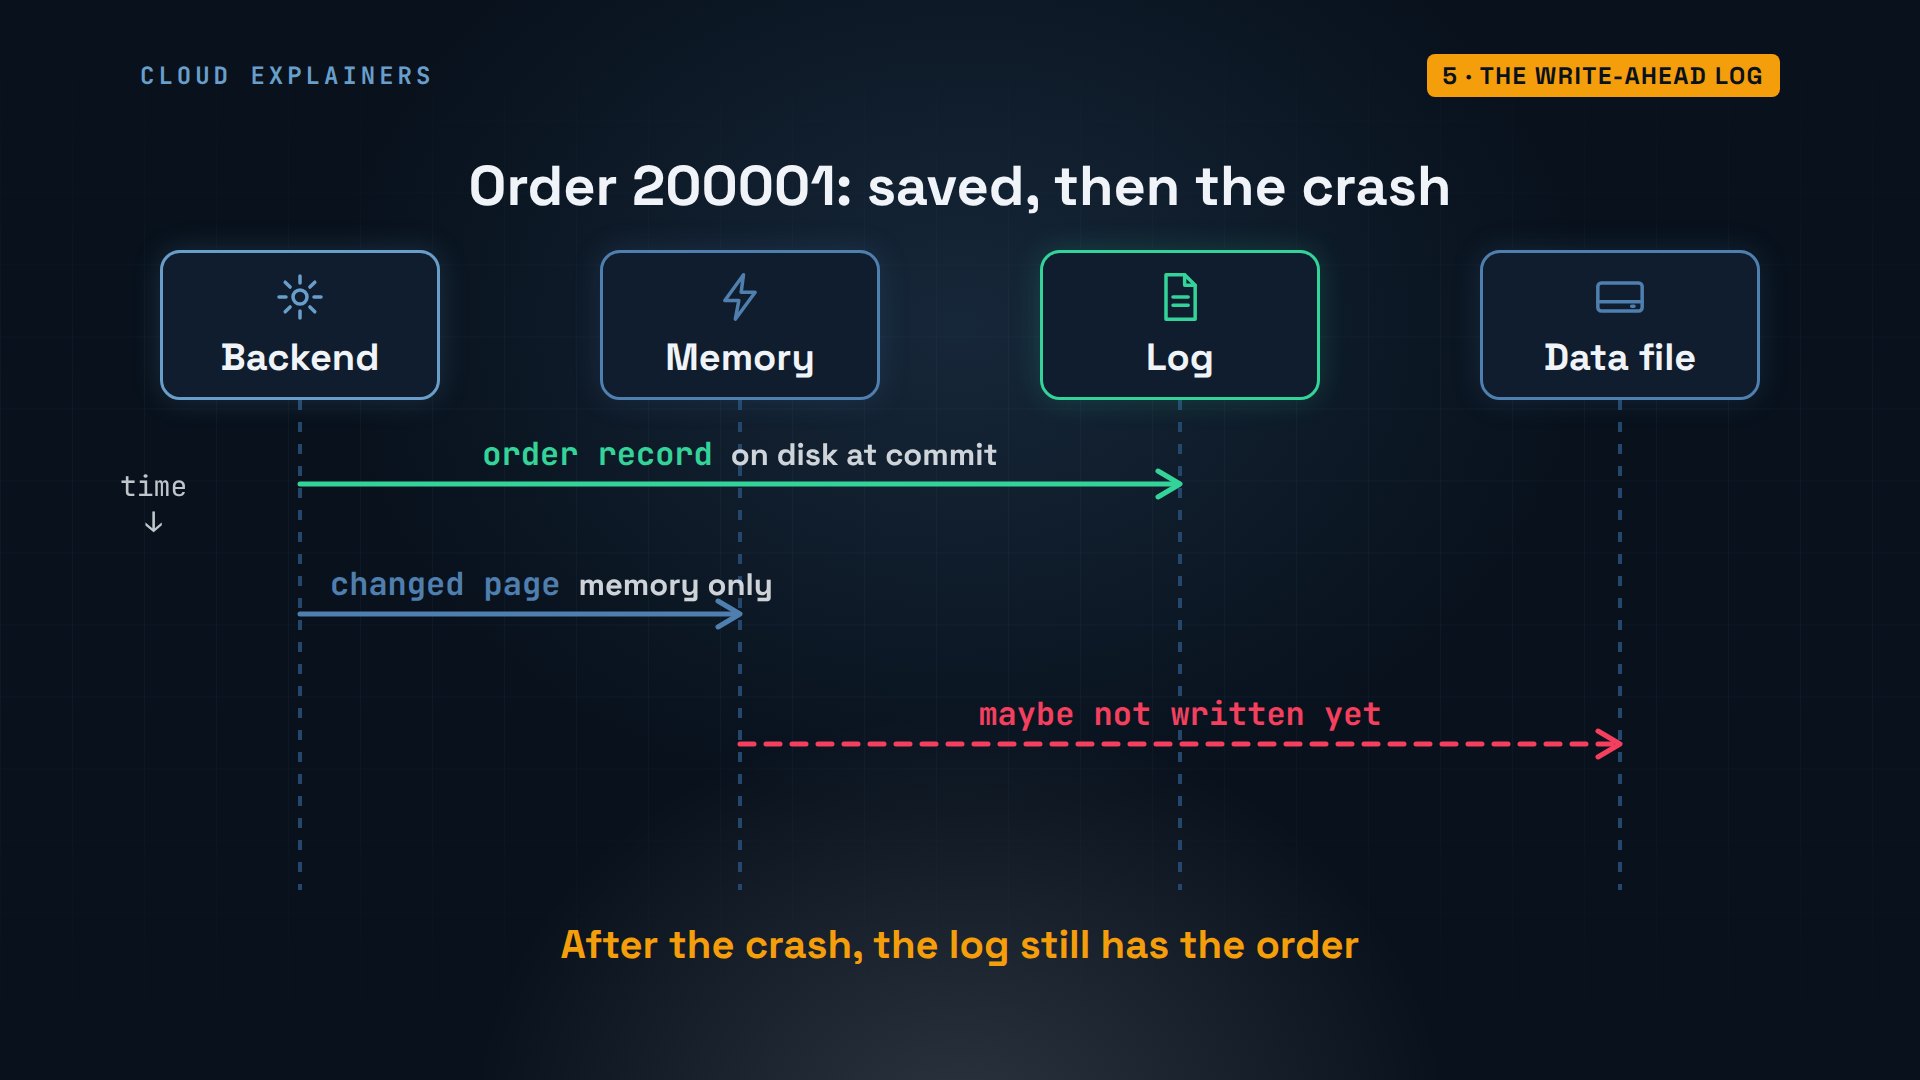
So what happens when Ana saves an order? Her backend changes the page in shared buffers: in memory only. Writing that page to the data file every time would be slow. Instead, it first writes a short record of the change to the write-ahead log. And when she commits, PostgreSQL makes sure that record is on disk before it says saved.
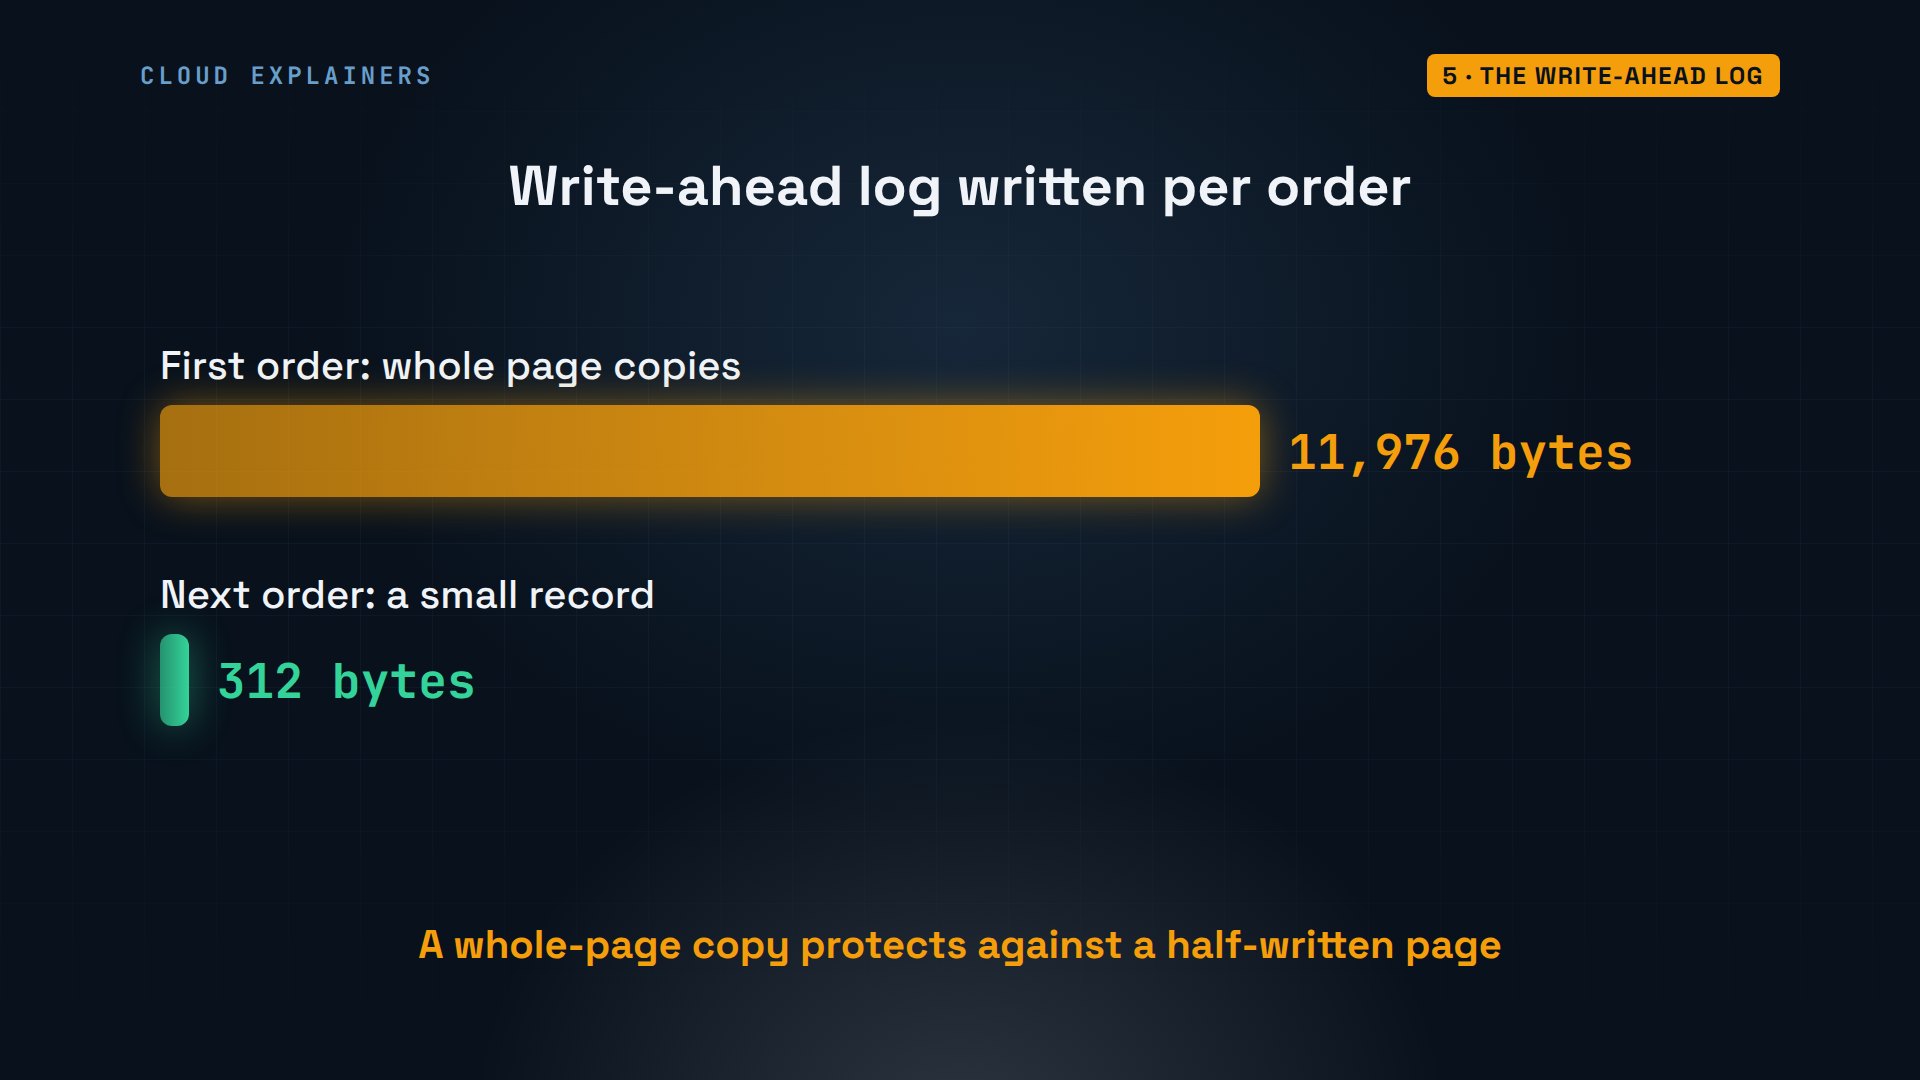
Every spot in that log has a position, called an LSN. One new order moved it forward 11,976 bytes. The next order: just 312.
shop=# SELECT pg_current_wal_lsn();pg_current_wal_lsn -------------------- 0/3F96790 (1 row)
shop=# INSERT INTO orders (customer_id, product_id, qty) VALUES (7, 3, 1);INSERT 0 1
shop=# SELECT pg_current_wal_lsn(), pg_wal_lsn_diff(pg_current_wal_lsn(), '0/3F96790') AS bytes;pg_current_wal_lsn | bytes --------------------+------- 0/3F99658 | 11976 (1 row)
shop=# INSERT INTO orders (customer_id, product_id, qty) VALUES (8, 4, 3);INSERT 0 1
shop=# SELECT pg_current_wal_lsn(), pg_wal_lsn_diff(pg_current_wal_lsn(), '0/3F99658') AS bytes;pg_current_wal_lsn | bytes --------------------+------- 0/3F99790 | 312 (1 row)
Why so different? The first change to a page after a checkpoint, the moment when PostgreSQL last wrote every changed page to disk, also copies the whole page into the log. If a crash ever left that page half written in the data file, the copy can rebuild it. After that, each change is just a small record of what changed.
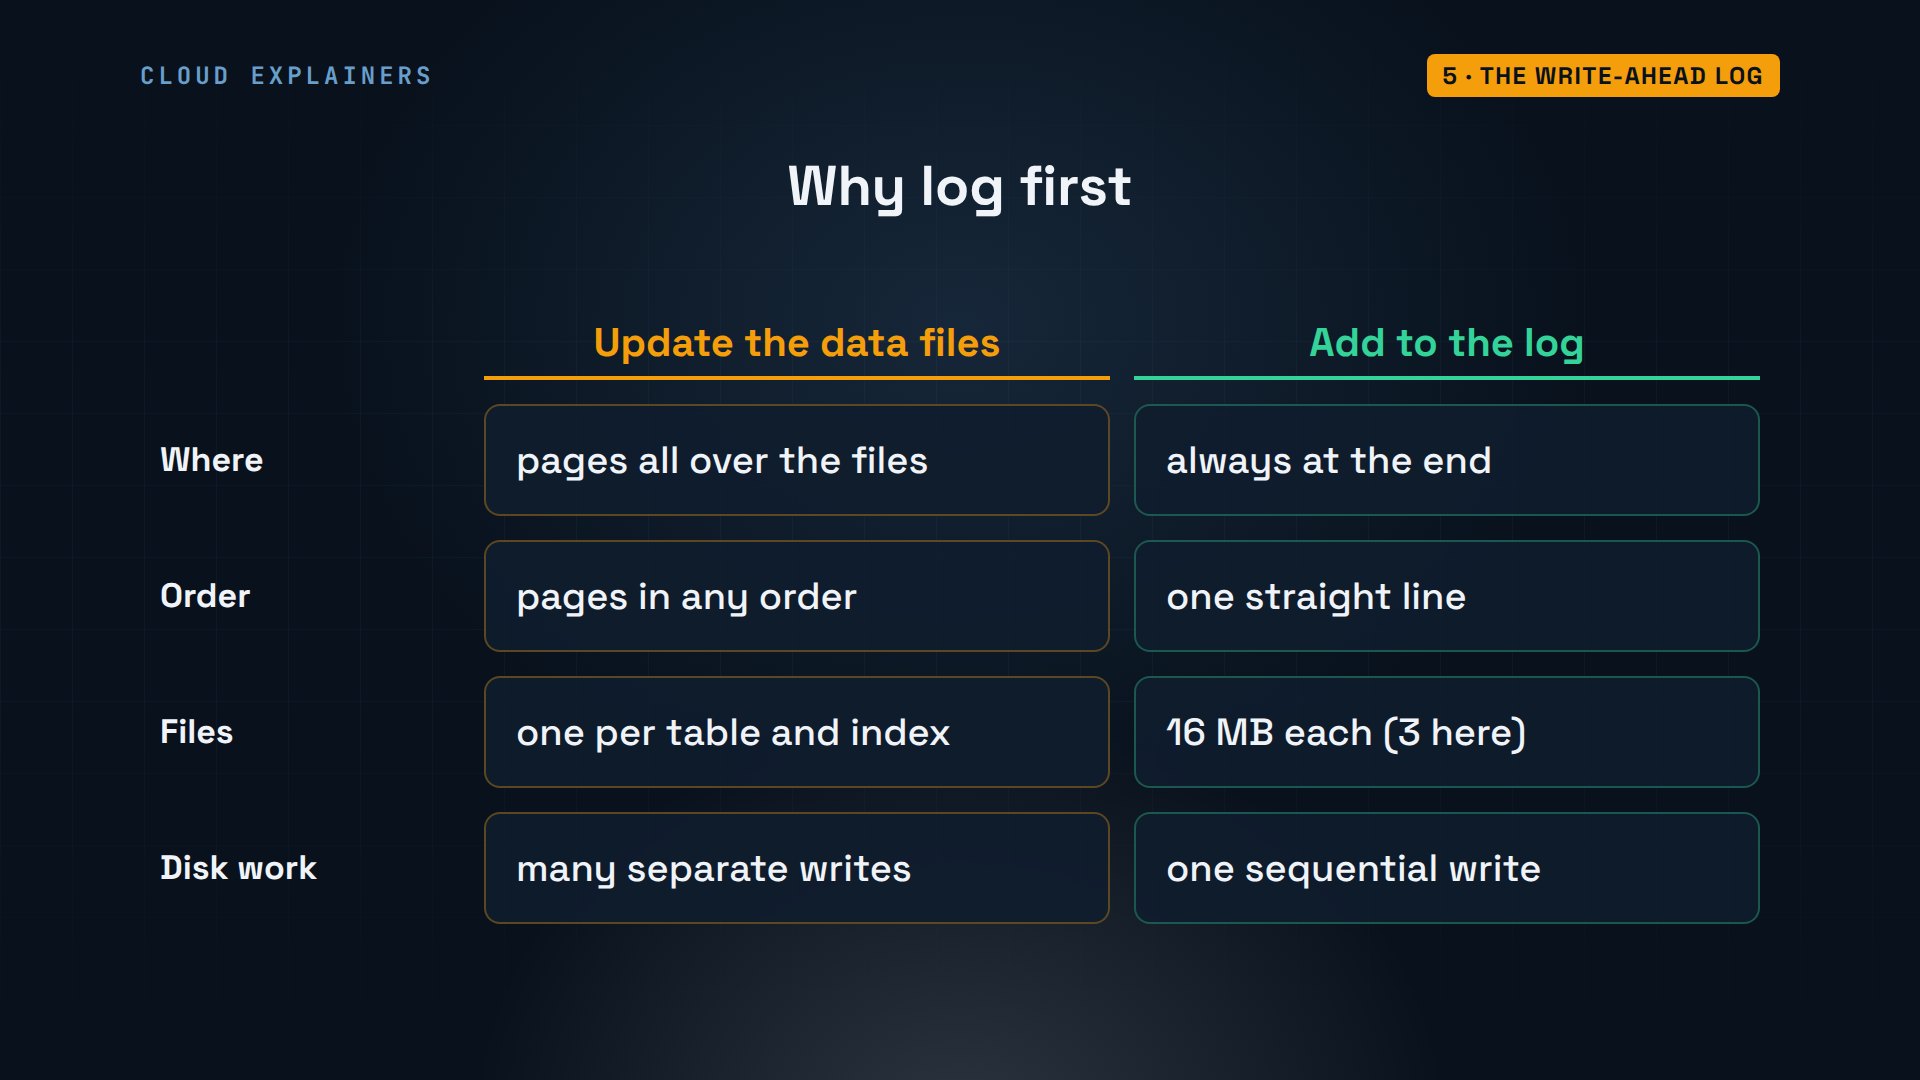
Why is a log faster than updating the data files? The data files are big, and one transaction can touch pages scattered all over them. The log is written in one straight line, at the end, into files of 16 MB each. Our server had 3 of them. Adding to the end of a file is about the cheapest write a disk can do.
Now the crash makes sense. When Ana's order was saved, its record was in the log on disk. The changed page was only in shared buffers, in memory, and the crash wiped that memory. The data file may not have had the order yet. But the log did.
On restart, the server's own log says it was not properly shut down, so it replays every log record since the last checkpoint: redo starts, redo done. Then: ready to accept connections.
PostgreSQL Database directory appears to contain a database; Skipping initialization

LOG:  checkpoint starting: immediate force wait
LOG:  checkpoint complete: wrote 2525 buffers (15.4%), wrote 3 SLRU buffers; 0 WAL file(s) added, 0 removed, 2 recycled; write=0.125 s, sync=0.054 s, total=0.217 s; sync files=111, longest=0.020 s, average=0.001 s; distance=35338 kB, estimate=35338 kB; lsn=0/3E24700, redo lsn=0/3E246A8
LOG:  starting PostgreSQL 18.6 (Debian 18.6-1.pgdg13+2) on x86_64-pc-linux-gnu, compiled by gcc (Debian 14.2.0-19) 14.2.0, 64-bit
LOG:  listening on IPv4 address "0.0.0.0", port 5432
LOG:  listening on IPv6 address "::", port 5432
LOG:  listening on Unix socket "/var/run/postgresql/.s.PGSQL.5432"
LOG:  database system was interrupted; last known up at 2026-11-03 01:57:03 UTC
FATAL:  the database system is starting up
LOG:  database system was not properly shut down; automatic recovery in progress
LOG:  redo starts at 0/3E246A8
LOG:  invalid record length at 0/3E2CA78: expected at least 24, got 0
LOG:  redo done at 0/3E2CA50 system usage: CPU: user: 0.00 s, system: 0.00 s, elapsed: 0.00 s
LOG:  checkpoint starting: end-of-recovery immediate wait
LOG:  checkpoint complete: wrote 7 buffers (0.0%), wrote 3 SLRU buffers; 0 WAL file(s) added, 0 removed, 0 recycled; write=0.008 s, sync=0.010 s, total=0.059 s; sync files=9, longest=0.007 s, average=0.002 s; distance=32 kB, estimate=32 kB; lsn=0/3E2CA78, redo lsn=0/3E2CA78
LOG:  database system is ready to accept connections
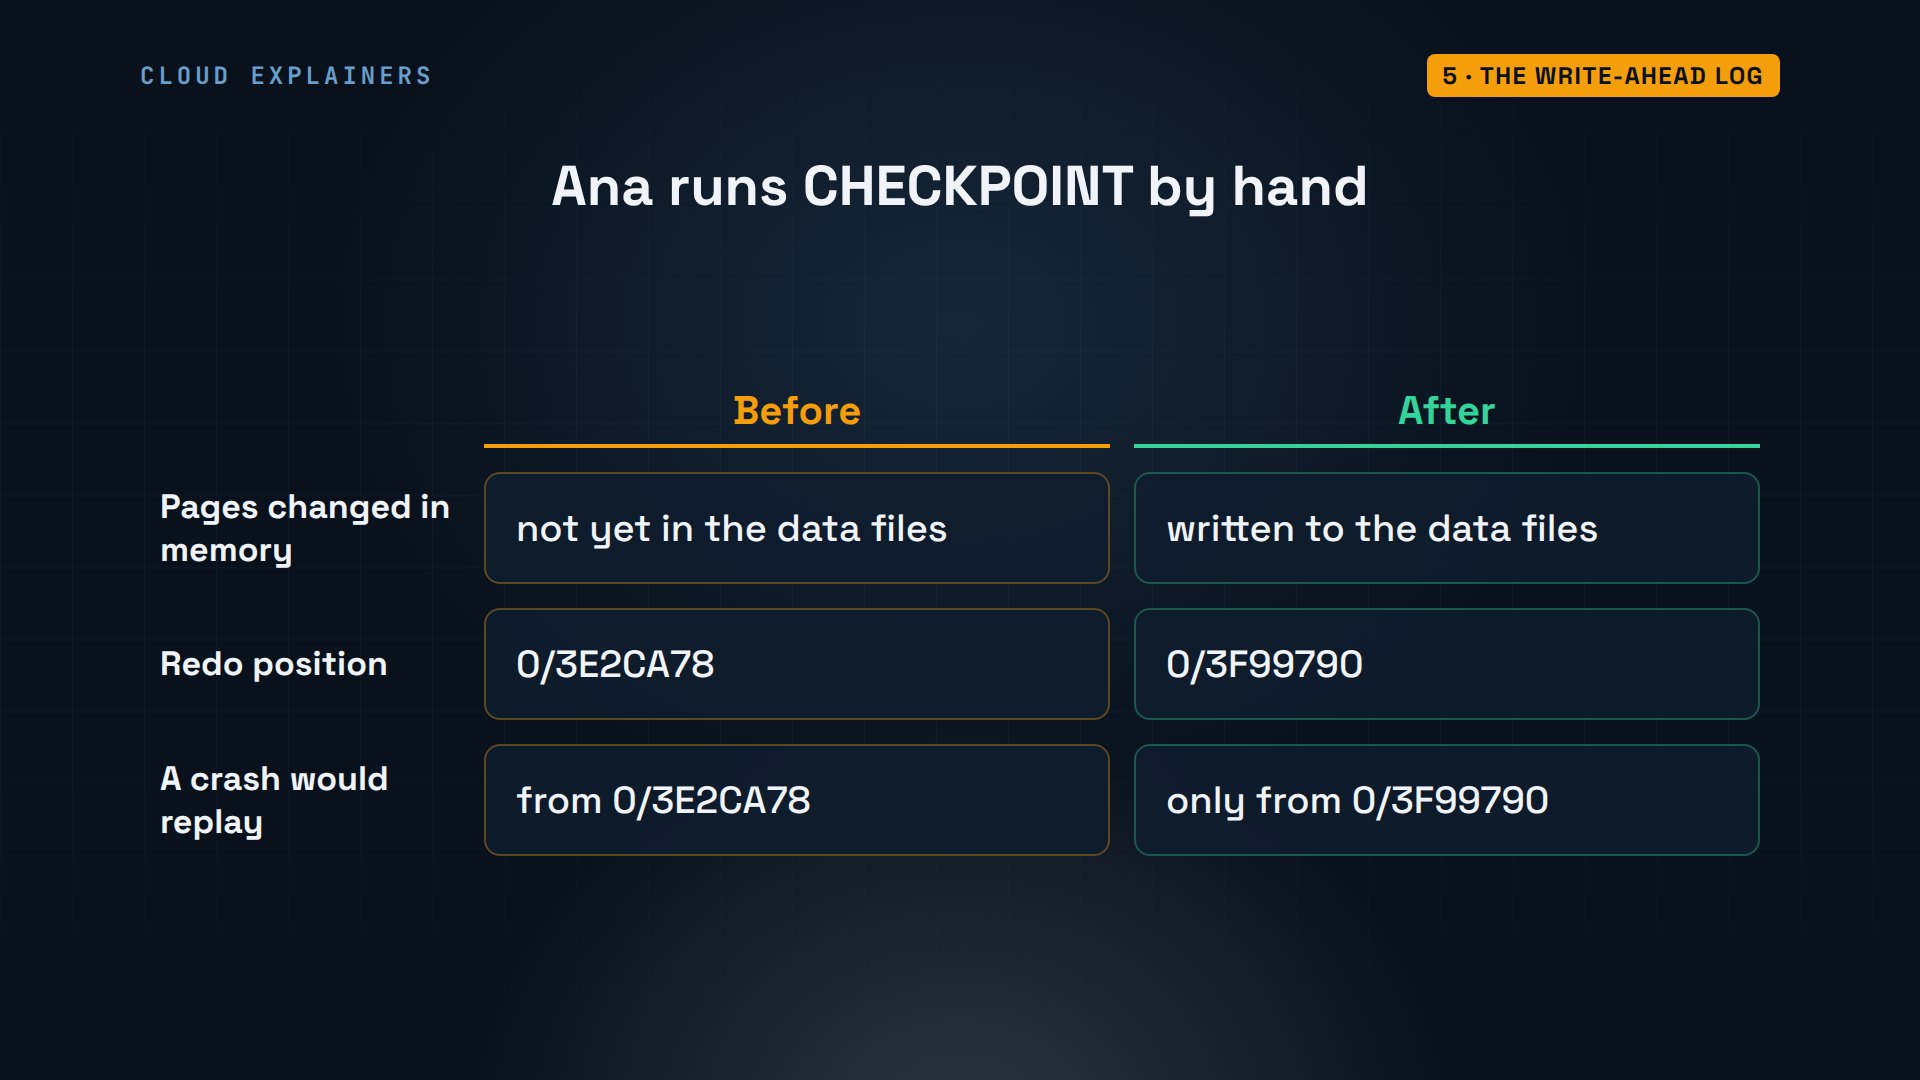
That starting point is a checkpoint. Every five minutes by default, or sooner after a lot of writes, the checkpointer writes every changed page from shared buffers to the data files, and records where the log's replay should begin. Older log files can then be recycled.
Here, Ana asks for one by hand. The redo position, where a replay would start, jumps forward. So recovery only ever replays the log written since the last checkpoint, which keeps it short.
Row versions and VACUUM
Last part: what happens when two connections use the same row at once? PostgreSQL never overwrites a row in place. An update writes a new version of the row, and marks the old one as replaced. Each version carries two transaction numbers: xmin, the transaction that created it, and xmax, the one that replaced or deleted it. This is called MVCC: multi-version concurrency control.
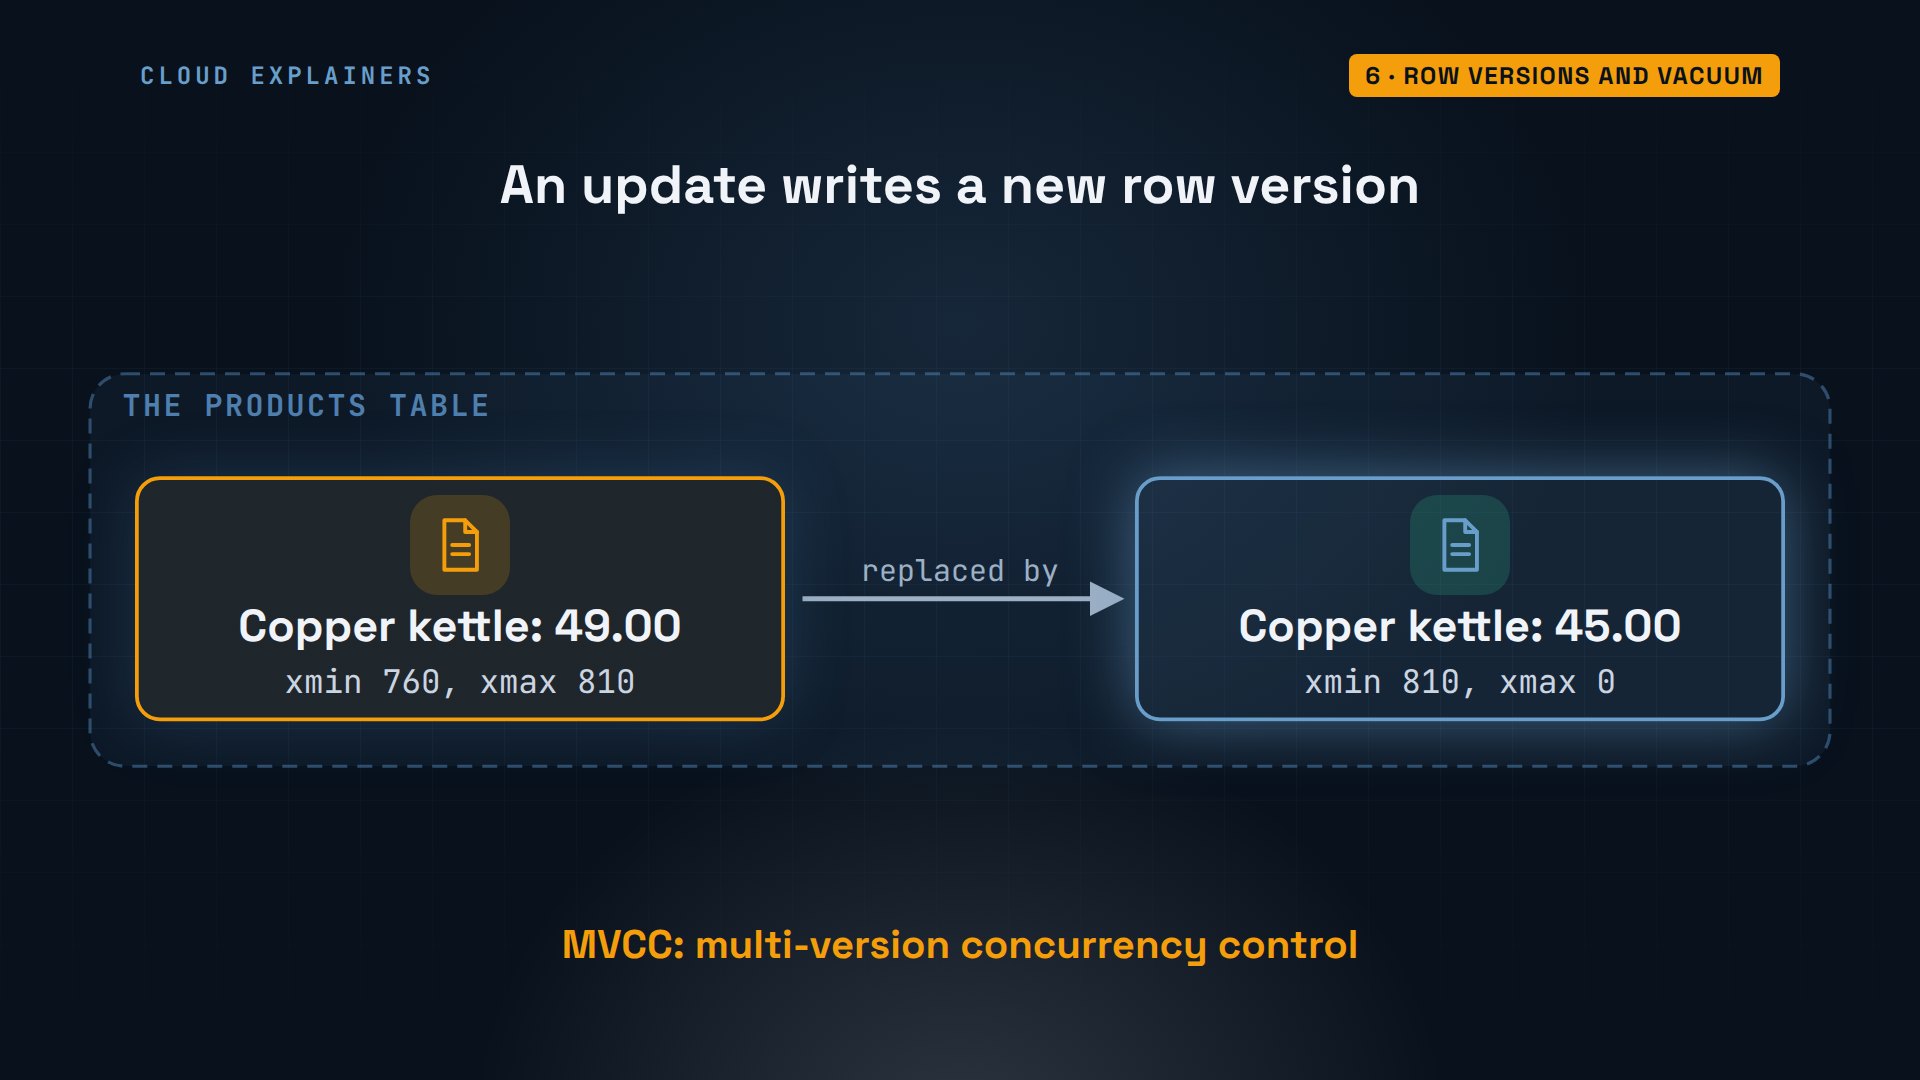
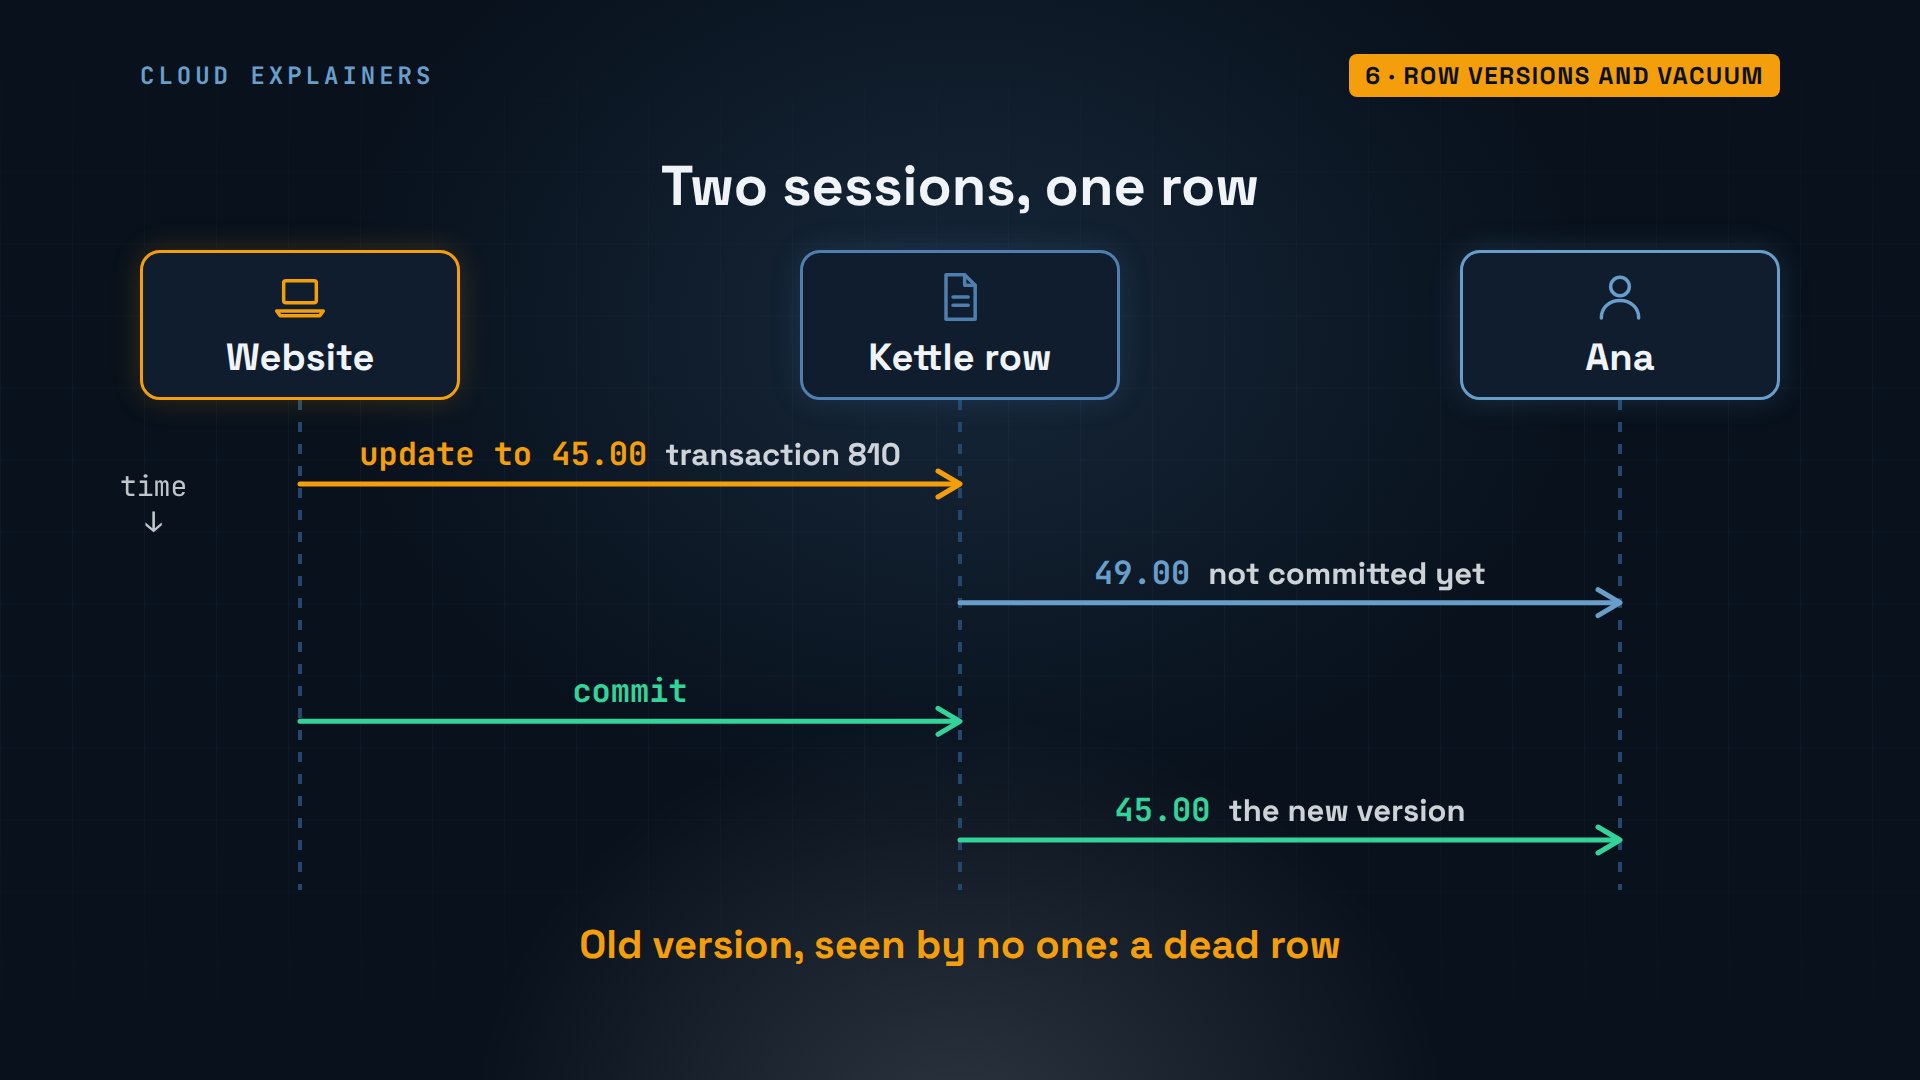
The website opens a transaction and drops the copper kettle's price to 45. Inside its own transaction, it already sees the new version: at a new place in the table, created by transaction 810.
shop=# BEGIN;BEGIN
shop=*# UPDATE products SET price = 45.00 WHERE id = 1;UPDATE 1
shop=*# SELECT ctid, xmin, xmax, name, price FROM products WHERE id = 1;ctid | xmin | xmax | name | price -------+------+------+---------------+------- (0,5) | 810 | 0 | Copper kettle | 45.00 (1 row)
Ana, at the same moment, still sees 49: the old version, with xmax 810. A replacement exists, but it isn't committed, so her query skips it. Readers don't wait for writers, and writers don't wait for readers.
shop=# SELECT ctid, xmin, xmax, name, price FROM products WHERE id = 1;ctid | xmin | xmax | name | price -------+------+------+---------------+------- (0,1) | 760 | 810 | Copper kettle | 49.00 (1 row)
When the website commits, Ana's next query sees 45. But the old version is still in the table's page, because another transaction that started earlier might still need it. Once no transaction can see it any more, it's a dead row.
Ana marks the first two weeks of orders as delivered: 20,159 rows updated, and 20,159 dead rows left behind. VACUUM finds them and frees their space for new rows. Dead rows: zero.
shop=# UPDATE orders SET status = 'delivered' WHERE created_at < '2026-01-15';UPDATE 20159
shop=# SELECT n_dead_tup FROM pg_stat_user_tables WHERE relname = 'orders';n_dead_tup ------------ 20159 (1 row)
shop=# VACUUM orders;VACUUM
shop=# SELECT n_dead_tup FROM pg_stat_user_tables WHERE relname = 'orders';n_dead_tup ------------ 0 (1 row)
You rarely run VACUUM yourself. The autovacuum launcher starts workers that clean a table once enough rows have changed: by default, 50 rows plus a fifth of the table. For 200,001 orders, that's about 40,050, so without Ana's VACUUM, our 20,159 dead rows would still be waiting. Without vacuum, tables fill up with dead rows and keep growing.
Recap
So here's how PostgreSQL works. Each connection gets its own backend process. The planner uses statistics to pick the cheapest plan. Pages are kept in shared buffers. Every change goes to the write-ahead log first, so a crash loses nothing committed, and checkpoints keep recovery short. Updates write new row versions, and vacuum cleans up the old ones.
If seeing a real crash and recovery made PostgreSQL feel less like a black box, subscribing helps this channel reach more beginners.
Every command and number in this video came from a real PostgreSQL 18.6 server on our own machine. Thanks for watching Cloud Explainers.
Sources
- PostgreSQL documentation, Architectural Fundamentals
- PostgreSQL documentation, The Path of a Query
- PostgreSQL documentation, Using EXPLAIN
- PostgreSQL documentation, Write-Ahead Logging
- PostgreSQL documentation, WAL Configuration (checkpoints)
- PostgreSQL documentation, Concurrency Control (MVCC)
- PostgreSQL documentation, Routine Vacuuming
- PostgreSQL documentation, pg_buffercache
Demos: real output from PostgreSQL in containers on our own machine, with a made-up shop's data; the crash is every PostgreSQL process being killed at once. Watch the full video on YouTube.
More videos
How to Fix Git Merge Conflicts
How to Fix No Space Left on Device in Linux
How the Internet Works
SQL vs NoSQL: When Each One Wins
How to Fix JWT Token Expired Errors (401 Unauthorized)
Claude API vs Claude Pro: Why Your Subscription Doesn't Include It

Why AI Agent Skills Beat Giant Prompts

Linux Cron Jobs Will Finally Make Sense After This

Security Logs Will Finally Make Sense After This
How to Fix a Security Leak: An API Key Pushed to GitHub
DNS Will Finally Make Sense After This
Never Ignore a Security Update
Two-Factor Authentication Will Finally Make Sense
Never Expose a Database to the Internet
SSH Keys vs Passwords: Which Is Safer for Security?
The 5 Levels of Linux Boot: From Power On to Login
The 5 Levels of Network Firewalls
Password Security: Why Hackers Crack Weak Passwords
Why Your Linux Server Runs Out of Memory
HTTP vs HTTPS: What Actually Changes on Your Network

Every Linux File Permission You Need to Know
Linux Processes vs Threads: When Each One Wins

The OSI Model Will Finally Make Sense After This

The 7 Levels of Git
Every Network Troubleshooting Command You Need
Hashing vs Encryption in Cybersecurity: When Each One Wins
Why the Internet Ran Out of IP Addresses
Linux Package Managers: apt vs Snap vs Flatpak
Why Python Is Slow (and When It Doesn't Matter)
TCP vs UDP: When Each One Wins

Stop Running Linux as Root (Do This Instead)

Linux Users and Groups Will Finally Make Sense

Why Phishing Beats Good Security (and How to Spot It)

The 7 Levels of Docker

AI Agents Will Finally Make Sense After This

Stop Using git push --force (Use This Instead)
Agent Skills vs MCP: When Each One Wins

Networking Will Finally Make Sense After This

Every Linux Command You Actually Need
The 7 Levels of Cybersecurity

Every System Design Concept You Need, in One Diagram